
AI dashboards are transforming how Amazon sellers manage their businesses by consolidating scattered data into a single, actionable view. These tools save time, improve accuracy, and help sellers make better decisions. Key benefits include:
- Time Savings: Reduce manual reporting time by up to 38 hours per week.
- Profit Boost: Increase profits by 10–15% with integrated analytics.
- Cost Tracking: Monitor over 40 Amazon fee types and track true profitability at the SKU level.
- Inventory Management: Predict stock needs, cut excess inventory costs by 22%, and reduce stockouts by 68%.
- Real-Time Alerts: Get instant notifications for issues like fee changes or stockouts.
Key Data Sources and Metrics for AI-Driven Cost Tracking
Core Amazon Data Sources

The effectiveness of any dashboard depends heavily on the quality of its data. Amazon’s Selling Partner and Advertising APIs provide essential reports like Payments, Inventory Ledger, FBA Storage Fee, and Business Reports. These reports are crucial for eliminating data gaps and ensuring accurate cost tracking.
One surprising fact for many sellers is that Amazon applies over 40 different fee types, yet most sellers only track 5–10 of these manually. Fees such as refund administration charges and inbound placement service fees often go unnoticed, gradually eating into profit margins.
These data streams are foundational for gaining a clear picture of costs and profitability.
Key Inventory Cost Metrics
Once the data is in place, the next step is to focus on critical metrics:
Profit per unit is calculated as:
"True Profit Per Unit = Sale Price – (COGS + Referral Fee + FBA Fulfillment Fee + Storage Fees + Ad Spend + Return Costs + Miscellaneous Fees)" – Dillon Carter, Co-Founder and COO, Aura
Key metrics to monitor include:
- Landed cost per ASIN: This includes product cost along with inbound freight, customs duties, packaging, inspection, and prep and labeling expenses.
- Complete FBA fees: These consist of referral fees (averaging around 15%), fulfillment fees, monthly storage fees, and the 3.5% Fuel & Logistics Surcharge, which came into effect on April 17, 2026.
- Aged inventory surcharges: Inventory stored beyond 181 days incurs surcharges, and storage fees jump from $0.87 per cubic foot (January–September) to $2.40 per cubic foot during Q4.
- TACoS and contribution margin: These metrics reveal whether advertising costs are translating into actual profit after accounting for all variable expenses.
- Weeks of cover and reorder points: These operational metrics help identify potential stockouts before they happen.
Tracking costs at the SKU level is critical. Relying on account-level averages can obscure the reality that high-margin products may be compensating for SKUs that are losing money once all fees are factored in.
How Emplicit Consolidates Data into a Single Source of Truth

Pulling raw data from APIs is just the beginning – the real challenge lies in organizing it into a format that provides actionable insights. This includes mapping COGS by SKU, standardizing fee categories, and aligning disbursements with an accrual-based profit and loss statement.
Emplicit simplifies this process by integrating Amazon’s Payments, Inventory Ledger, Business Reports, and Advertising data into a single, unified view. They allocate account-level expenses down to individual ASINs, ensuring a clear understanding of profitability. This level of precision is essential because sellers often overestimate profits by 20–40% when relying on incomplete data.
The resulting dashboard offers a transparent look at which ASINs are driving profit, which products are approaching the 181-day aged inventory threshold, and where upcoming fee increases may have the most impact. By eliminating the need for manual reporting, this consolidated approach enables sellers to leverage real-time alerts and predictive analytics effectively.
sbb-itb-e2944f4
How to Use Amazon SP-API with Claude to Build AI Dashboards
Benefits of Real-Time Monitoring with AI Dashboards
Manual vs. AI-Driven Amazon Dashboard: Key Differences at a Glance
Real-Time Alerts and Anomaly Detection
AI dashboards shine when it comes to catching issues before they start impacting your bottom line. By integrating directly with Amazon’s SP-API, these dashboards continuously track key metrics like sales velocity, fee changes, and inventory levels. When something unexpected happens – like a sudden spike in return rates or an unusual cost increase – the system flags it immediately. Sellers using AI tools often report saving 30% to 50% of their weekly operational hours, largely because they’re no longer wasting time chasing down problems that could’ve been identified days earlier.
These real-time alerts are especially valuable for managing fee adjustments, helping you stay within optimal operating windows without the need for constant manual oversight.
"Good forecasting doesn’t predict the future. It keeps you in the safe window between stockout and surcharge – and in 2026, that window is narrower than it used to be." – SKU Compass
While real-time alerts handle immediate concerns, predictive analytics take it a step further by helping you prepare for what’s ahead.
Predictive Analytics for Cost and Demand
AI dashboards don’t just react – they anticipate. Predictive analytics use live sales velocity data to forecast inventory needs, moving beyond static reorder points. For example, they can project when stock will run out and issue alerts when inventory drops below a 7-day cover. This approach transforms restocking from a reactive scramble into a strategic process.
Some dashboards even offer "what-if" scenarios, letting you simulate the effects of demand changes or fee increases on your cash flow and profitability. Charlene Anderson, Founder and Owner of Purveyor of All Things Creative, shared how adopting Amazon’s AI canvas experience in March 2026 changed her approach:
"The predictive insights allow me to feel confident about making decisions – whether it’s shifting around inventory or introducing a new product line." – Charlene Anderson, Founder and Owner, Purveyor of All Things Creative
For instance, a kitchenware brand that switched from spreadsheets to AI-driven forecasting in 2025 saw impressive results. Over 12 months, they reduced stockouts by 68% and cut excess inventory costs by 22% by using leaner buffers during slower periods.
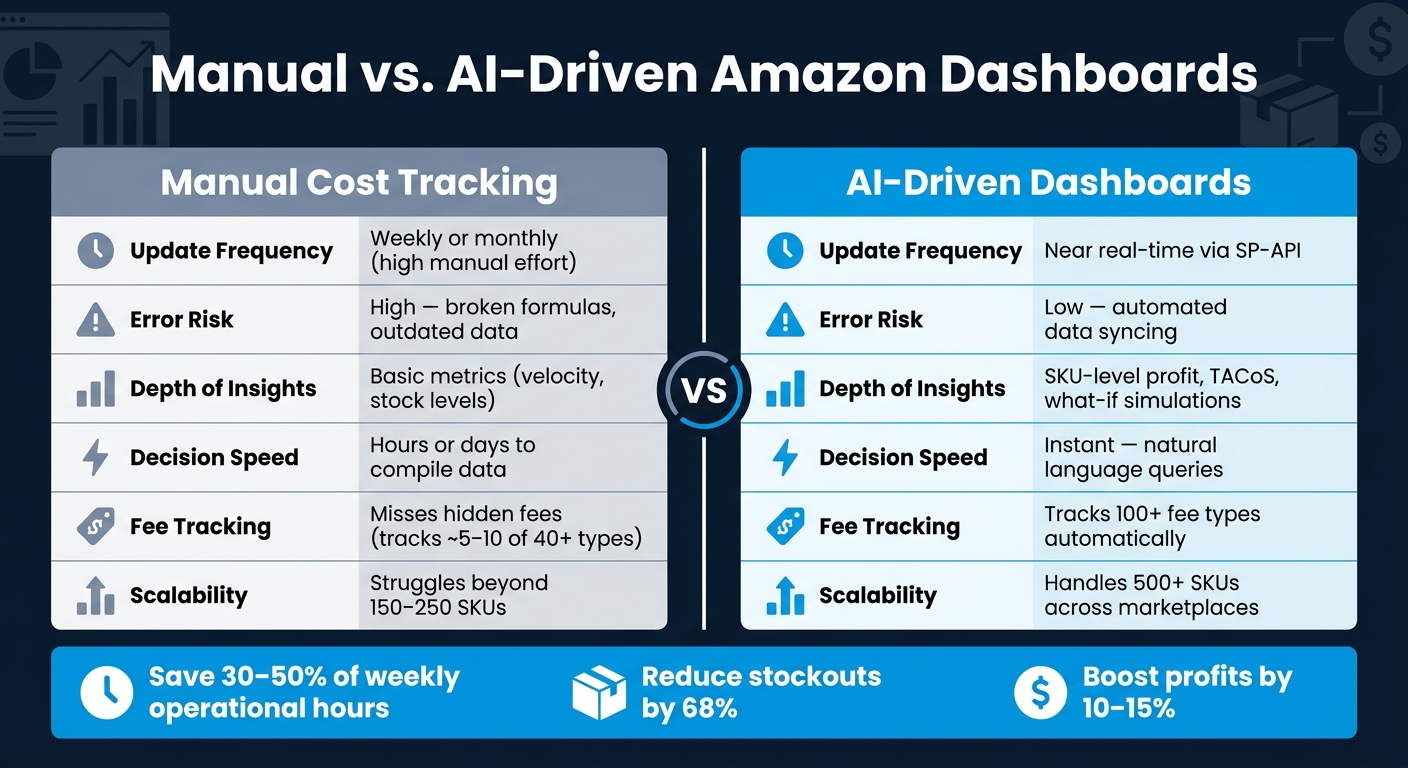
Manual vs. AI-Driven Monitoring: A Side-by-Side Comparison
AI-driven dashboards outpace manual tracking in nearly every way, offering deeper insights and faster decision-making.
| Feature | Manual Cost Tracking | AI-Driven Dashboards |
|---|---|---|
| Update Frequency | Weekly or monthly (requires high manual effort) | Near real-time via SP-API |
| Error Risk | High; prone to broken formulas and outdated data | Low; automated data syncing |
| Depth of Insights | Basic metrics like velocity and stock levels | Detailed insights like SKU-level profit, TACoS, and simulations |
| Decision Speed | Hours or days to compile data | Instant, with natural language queries |
| Fee Tracking | Often misses hidden fees (40+ types) | Tracks over 100 fee types automatically |
| Scalability | Struggles with 150–250 SKUs | Handles 500+ SKUs across marketplaces |
This comparison highlights how AI dashboards not only save time but also provide the depth and accuracy needed to scale efficiently.
Setup and Requirements for AI Dashboards
Technical and Data Prerequisites
To ensure an AI dashboard functions properly, clean and well-connected data is a must. At the core of this setup are Amazon’s Selling Partner API (SP-API) and the Advertising API, which provide access to real-time data like sales, fees, inventory, and campaigns.
However, sellers often face two major hurdles: SKU standardization and accurate landed COGS. If SKU names differ across Seller Central, your 3PL, and accounting software, data reconciliation becomes nearly impossible. Likewise, incomplete cost-of-goods figures – such as those missing inbound freight, duties, or packaging costs – can throw off every margin calculation downstream.
"If the dashboard cannot tell which cost belongs to which unit, every margin chart downstream becomes suspect." – The FBA Guys
To avoid these issues, tie COGS to units sold (accrual basis) rather than units purchased. This prevents distorted profit views during months when you stockpile inventory that hasn’t been sold yet. Additionally, with Amazon’s 2026 fee changes, ensure your dashboard tracks fees at the FNSKU level instead of just the parent ASIN level.
AI Dashboard Implementation Options
Once your data is clean and your metrics are standardized, the next step is choosing how to implement the dashboard. The best option depends on your catalog size and technical resources.
- For smaller catalogs (under 50 SKUs): Seller Central tools combined with spreadsheets might be enough.
- For medium catalogs (50–200 SKUs): Manual data management becomes impractical, making SaaS solutions more efficient.
- For larger operations ($5M+ in revenue or 200+ SKUs): A custom BI setup, such as AWS QuickSight, or a fully managed solution is often necessary to handle the complexity.
AWS QuickSight now includes generative AI features, allowing users to describe their needs in plain English and generate dashboards in minutes instead of hours. However, custom setups still require expertise in data engineering, SQL, and ongoing maintenance to keep up with Amazon’s evolving API schemas.
For teams looking to offload technical burdens, Emplicit’s managed solution can be a game-changer. They handle SP-API authorization, fee mapping, and data normalization, freeing up your team to focus on strategy rather than data logistics. This can be especially valuable when fee structures change rapidly.
In-House vs. Emplicit-Managed Solutions: A Side-by-Side Comparison
The choice between building an in-house solution and opting for a managed service comes down to control versus speed. Here’s a closer look at the tradeoffs:
| Feature | In-House (Custom Build) | Emplicit-Managed Solution |
|---|---|---|
| Complexity & Expertise Required | High; requires expertise in data pipelines, multiple API integrations, SQL, Python, and BI tools | Low; provider handles technical work using pre-built SP-API and Advertising API connectors |
| Time to Launch (Speed) | Weeks to months for development and testing | Days; typically requires only API authorization |
| Maintenance Effort | High; manual updates needed for API changes and fee logic shifts | Low; provider manages updates, including adjustments for 2026 surcharge changes |
| Customization | Total; can integrate any off-Amazon data source | Moderate; limited to supported integrations within the provider’s ecosystem |
| Day-to-Day Operational Agility | Improves day-to-day operational agility | Improves day-to-day operational agility |
Best Practices for Getting the Most Out of AI Dashboards
Day-to-Day Best Practices
A well-designed dashboard is only as good as the consistency with which it’s used to drive actionable decisions.
Successful sellers stick to a straightforward weekly routine: check for session-to-conversion drops on Mondays to address any listing or pricing issues early, review coupon performance on Wednesdays to ensure promotions are boosting unit sales, and audit inventory velocity on Fridays to prepare for weekend demand. This rhythm helps catch small issues before they snowball into costly problems.
In addition to the weekly schedule, set up automated alerts for anomalies. Triggers like a 20% week-over-week ACOS increase, three consecutive days of negative contribution margins, or stock levels dropping below a 14-day supply can serve as early warnings. Pair these alerts with a monthly close process: reconcile Seller Central payments with bank deposits and update SKU-level COGS rules to ensure your financial data stays accurate. These consistent checks help align your dashboard metrics with your broader growth objectives.
Aligning Dashboard Metrics with Growth Goals
One common pitfall is tracking too many metrics without linking them to specific goals. Instead, focus on four key areas: Revenue/Growth (like total sales and year-over-year performance), Profitability (such as contribution margin and TACoS), Advertising Efficiency (e.g., ACOS by campaign type), and Operational Health (metrics like stockout rates and inventory turnover).
Among these, TACoS is especially important. It measures ad spend as a percentage of total revenue, offering a comprehensive view of how advertising impacts your bottom line. Sellers who integrate advertising, pricing, and inventory data into a unified analytics system often see a 10–15% boost in profits compared to those managing these areas separately.
Emplicit takes this a step further by tying these metrics directly to business planning. For example, they use SKU-level net profit data to decide which products to scale, reprice, or discontinue – avoiding the pitfalls of relying on account-level averages, which can obscure underperforming products.
Refining AI Models Over Time
Keeping your AI models up to date is just as important as monitoring daily metrics. Without regular updates, models lose accuracy as your product catalog, supplier relationships, and market conditions change.
Retrain your models monthly to prevent drift and incorporate new market data. Well-maintained models can achieve forecast accuracy rates of 94% for 30-day horizons and 87% for 60-day horizons, compared to just 71% and 58% for manual systems. Update your COGS quarterly to account for changes in supplier pricing, freight costs, and customs duties. Conduct weekly exception reviews to identify data mismatches, outdated records, or items with unusually high reservations.
Seasonal events like Prime Day or Black Friday present unique challenges. Manual forecasting often underestimates post-promotion demand by 20–35%. AI models, however, can account for these "event tails" and significantly reduce forecasting errors. Focus your refinement efforts on A-SKUs – the 20% of products that generate 80% of your revenue – since mistakes here can have the greatest financial impact.
The table below summarizes the key refinement steps and their recommended frequency for keeping your dashboard accurate and effective.
| Refinement Step | Frequency | Purpose |
|---|---|---|
| Model Retraining | Monthly | Prevents accuracy loss as market conditions evolve |
| COGS Updates | Quarterly | Reflects changes in supplier pricing, freight, and duties |
| Exception Reviews | Weekly | Identifies data drift, stranded inventory, and listing errors |
| Lead Time Audit | Per PO | Updates reorder points based on supplier delivery speed |
Conclusion
Running an Amazon business without access to real-time data often means you’re stuck reacting to problems instead of planning ahead. This is where AI dashboards come in, turning scattered reports into a single, actionable view of your business.
By integrating advertising, pricing, and inventory data, sellers can achieve a 10–15% boost in profits while reclaiming up to 38 hours per week previously wasted on manual report reconciliation. AI-powered forecasting also helps minimize stockouts and cut down on excess inventory costs.
These dashboards go beyond surface-level insights by offering SKU-level financial clarity. They account for over 40 different Amazon fees, making it easier to pinpoint which products are underperforming and which have the potential for greater returns. Charlene Anderson, founder of Purveyor of All Things Creative, highlights this advantage:
"It would typically take me hours to pull together the type of information and recommendations that a canvas shares in seconds. The predictive insights allow me to feel confident about making decisions – whether it’s shifting around inventory or introducing a new product line."
Unified data doesn’t just simplify decision-making – it scales with your business. Whether you’re managing one storefront or branching out into multiple marketplaces, AI dashboards enable faster, more informed decisions.
For sellers eager to embrace this approach, Emplicit offers managed solutions that directly connect SKU-level data to strategic planning. This allows you to scale efficiently and confidently, without the guesswork or hassle of complicated setups.
FAQs
What data do I need to connect for an AI dashboard to work?
To set up an AI dashboard, integrate data from Seller Central. This includes sales reports, ad spend, inventory levels, refunds, fees, and other key metadata like product details and campaign information. By doing so, the dashboard will deliver a complete view of your sales, advertising performance, inventory status, and financial metrics.
How do AI dashboards calculate true profit per SKU with Amazon fees?
AI dashboards provide a clear picture of true profit per SKU by taking into account all applicable Amazon fees. This includes referral fees, fulfillment costs, storage charges, and advertising expenses. These fees are deducted from the sale price and the cost of goods sold (COGS), delivering a precise profit calculation for each SKU.
What alerts should I set up to prevent stockouts and aged-inventory surcharges?
Keep an eye on your inventory by setting up alerts for critical situations like stock running below the reorder point, stockouts, or even the risk of having too much inventory. Pay special attention to items nearing 28–35 days of supply to avoid potential aged-inventory surcharges. These alerts can help you stay ahead, maintain the right stock levels, and cut down on avoidable fees.