
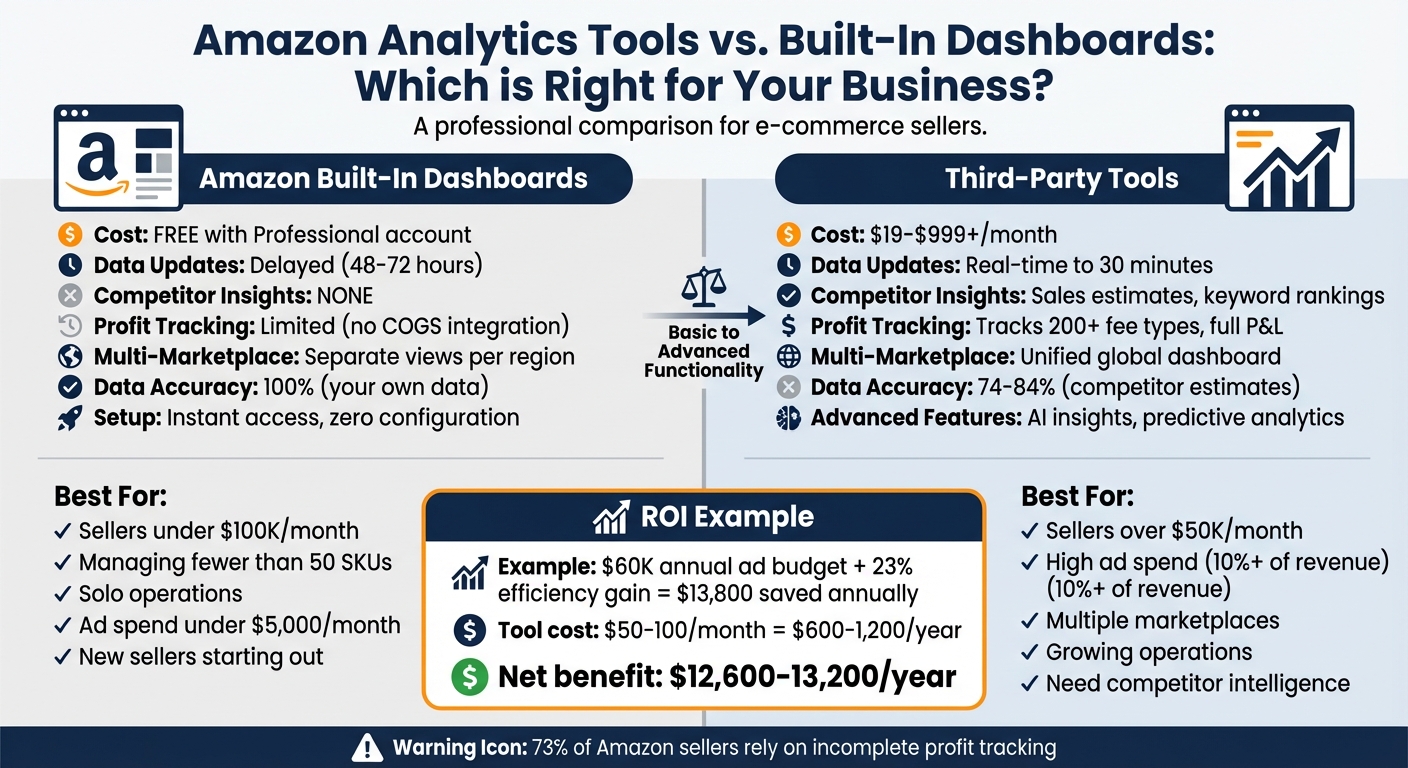
Running an Amazon business effectively requires tracking data. Amazon offers free built-in dashboards through Seller Central, which provide accurate insights into your sales, traffic, and account health. However, they come with limitations like delayed updates, no competitor visibility, and incomplete profit tracking.
Third-party tools, such as Helium 10, Jungle Scout, and Sellerboard, fill these gaps by offering features like real-time data, competitor analysis, and detailed profitability tracking. While they require a subscription (starting at $19/month), these tools are ideal for larger or growing businesses managing complex operations or high ad spend.
Quick Comparison
| Feature | Amazon Built-In Dashboards | Third-Party Tools |
|---|---|---|
| Cost | Free with Professional account | $19–$999/month |
| Data Updates | Delayed (48–72 hours) | Real-time to 30 minutes |
| Competitor Insights | None | Sales estimates, keyword rankings |
| Profit Tracking | Limited (no COGS integration) | Tracks 200+ fee types, full P&L |
| Multi-Marketplace | Separate views per region | Unified global dashboard |
For small sellers, Amazon dashboards may suffice. For businesses scaling operations or managing high ad budgets, third-party tools provide deeper insights and save time. Choose based on your business size, data needs, and growth stage.
Amazon Built-In Dashboards vs Third-Party Analytics Tools Comparison
Amazon Built-In Dashboards: What They Offer and Where They Fall Short
Main Features of Amazon’s Built-In Dashboards
Amazon offers a suite of free analytics tools within Seller Central, providing sellers with essential insights into their business performance. At the core is the Business Reports, which include a Sales Dashboard showcasing key metrics like units sold, total sales, and average order value. These reports are divided into two types: "By Date" reports, covering sales, traffic, and seller performance, and "By ASIN" reports, which focus on detail page sales and traffic.
For sellers in the Amazon Brand Registry, there’s Brand Analytics (ABA), a tool that has been free since 2020. It includes five specialized reports: Amazon Search Terms, Repeat Purchase Behavior, Market Basket Analysis, Item Comparison/Alternate Purchase Behavior, and Demographics. These reports provide insights into customer search habits and purchasing patterns.
In 2025, Amazon introduced the Custom Analytics Dashboard, allowing sellers to create tailored reports using over 100 metrics spanning sales, inventory, and customer data. Sellers can use up to 18 tiles per report and access pre-built templates like "Prime Day Recap" and "Sales & Pricing Trends". Meanwhile, the Advertising Console tracks PPC campaign performance with metrics such as clicks, spend, Click-Through Rate (CTR), and Advertising Cost of Sale (ACoS). However, it lacks the advanced metrics often found in third-party tools. Lastly, Inventory Reports help monitor stock levels, FBA inventory age, and stranded inventory, aiding in basic restocking decisions.
These tools provide essential insights at no additional cost, giving sellers a solid starting point for tracking their performance.
Benefits of Built-In Dashboards
The most appealing aspect of Amazon’s built-in dashboards is that they are completely free for sellers with a Professional Seller account. There’s no complicated setup; sellers can access their data immediately after logging in. Since the data comes directly from Amazon, its accuracy is reliable. As Ash Metry, Founder & CEO of Keywords.am, explains:
"Data from Amazon is fully accurate".
The Account Health dashboard stands out as an indispensable tool. It serves as the official source for tracking performance metrics related to customer service, shipping, and compliance with Amazon’s policies. Metrics like Order Defect Rate (ODR), Late Shipment Rate, and Pre-fulfillment Cancel Rate are critical for avoiding account suspension. Additionally, Brand Analytics provides exclusive insights – such as Search Query Performance and Market Basket Analysis – that third-party tools can only approximate.
These features make Amazon’s dashboards a dependable resource for monitoring key performance indicators and maintaining account health. However, they do come with limitations.
Drawbacks of Built-In Dashboards
One major drawback is the delay in data updates. For instance, the Profit Analytics Dashboard is typically 48–72 hours behind real time, while Brand Analytics data refreshes only once a week.
Another issue is the lack of integration for Cost of Goods Sold (COGS). This means the "profit" figures displayed only account for revenue minus Amazon fees and advertising spend, leaving sellers without a clear view of their actual net profit. This gap in financial tracking affects almost 73% of Amazon sellers, leading them to rely on incomplete profitability data.
The dashboards also fail to provide any insights into competitors. Sellers are limited to viewing data for their own products, with no visibility into competitor sales, pricing, or inventory trends. Furthermore, the Custom Analytics Dashboard excludes advertising metrics such as ACoS, ROAS, and TACoS, limiting its usefulness for advertising analysis. Sellers managing multiple regional accounts face additional hurdles, as there is no unified view for cross-marketplace data; switching between accounts is necessary to access information from different regions.
These shortcomings highlight the need for more advanced tools that can fill the gaps in profitability tracking, competitive analysis, and multi-marketplace management.
| Feature | Advantage | Limitation |
|---|---|---|
| Cost | Free with Professional account | None |
| Data Accuracy | 100% accurate from Amazon’s systems | 48–72 hour delay for profit data |
| Setup | Instant access with zero configuration | No COGS integration for true net profit |
| Historical Data | Includes recent periods | Often limited to a 90-day lookback |
| Competitor Insights | Not applicable | Zero visibility into competitor data |
| Multi-Marketplace | Separate views per region | No consolidated global view |
| Advertising Metrics | Basic ACoS in the Advertising Console | No TACoS or integrated ad data |
sbb-itb-e2944f4
Third-Party Amazon Analytics Tools: Features and When to Use Them
Advanced Features in Third-Party Tools
Third-party analytics platforms step in where Amazon’s built-in dashboards fall short, offering tools that go beyond basic performance metrics. One standout feature is competitor intelligence. For instance, Helium 10’s Cerebro allows sellers to perform reverse ASIN lookups, revealing the keywords competitors rank for and highlighting untapped market opportunities. The PLOTT DATA Research Team compares Amazon’s approach to playing poker:
"Amazon’s philosophy is to give you data about your own performance, not your competitors’. It’s like playing poker where you can only see your own cards."
These tools also provide detailed profit and loss accounting, tracking over 200 Amazon fee types – including long-term storage and removal orders – so sellers can get a clear picture of their profitability.
Another major advantage is real-time data synchronization. Unlike Amazon’s Profit Analytics Dashboard, which can lag by 48–72 hours, tools like Nova Analytics refresh data as frequently as every 30 minutes. This allows sellers to react quickly to competitor price changes or PPC issues. Additionally, these platforms address a crucial gap in Amazon’s dashboards by tracking organic keyword rankings. Since organic search drives around 80% of Amazon sales, this feature is essential for monitoring visibility.
Some platforms even automate tasks like identifying FBA reimbursement opportunities. Tools such as Refund Genie and Sellerise automatically detect lost or damaged inventory, often recovering $500 to $2,000 or more for sellers. For those operating across multiple regions, platforms like PLOTT DATA consolidate data from Amazon US, the UK, Germany, and even non-Amazon marketplaces like Walmart, eBay, and Shopify into one unified dashboard.
These advanced features, paired with scalability, make third-party tools invaluable for sellers looking to grow their businesses.
Customization and Growth Options
Third-party tools aren’t just about analytics – they’re designed to evolve with your business. Take Sellerboard, for example. Starting at $19 per month for up to 3,000 orders, it offers specialized dashboards for tracking trends, indirect expenses, and return rates. As your order volume grows, the platform scales based on monthly orders rather than locking features behind higher-priced tiers.
Helium 10, often referred to as the "Swiss army knife" of Amazon tools, offers over 30 features that sellers can customize to fit their needs. Its pricing tiers – Starter at $39 per month, Platinum at $99 per month, and Diamond at $229 per month – unlock advanced capabilities like market share analysis, keyword research, and multi-marketplace tracking as businesses expand.
Jungle Scout combines product research with sales analytics, using AI to generate narrative business reports and track metrics like Total Advertising Cost of Sale (TACoS) and Return on Ad Spend (ROAS). Its pricing ranges from $49 per month for the Basic plan to $129 per month for the Professional plan, with added customization options to support growing businesses.
Many of these tools now incorporate AI-driven insights for improving margins and offer mobile-first analytics, providing real-time alerts and predictive restock recommendations.
Feature Comparison: Third-Party Tools vs. Built-In Dashboards
| Feature | Amazon Built-In Dashboards | Third-Party Tools |
|---|---|---|
| Competitor Visibility | Only your own data | Sales estimates, pricing history, keyword rankings |
| Keyword Tracking | Limited to search terms | Full organic and sponsored rank tracking |
| Update Frequency | Daily to weekly (48–72 hour delay) | Real-time to every 30 minutes |
| Financial Tracking | Basic, often missing hidden fees | Tracks 200+ fee types and COGS |
| Data Accuracy | 100% for your own products | Approximately 74–84% for competitor estimates |
| Multi-Marketplace | Separate views for each region | Consolidated global dashboard |
| Inventory Forecasting | Basic 30-day trailing averages | Predictive analytics accounting for seasonality |
| Pricing | Included with a Professional seller account | Ranges from $19 to $999+ per month |
Jungle Scout boasts a data accuracy rate of 84.1% for sales estimates, compared to Helium 10’s 74%. While these figures don’t match the 100% accuracy for your own data, the added competitor insights and predictive tools make up for the difference. Revenue estimation for top-tier tools typically varies by only ±8%, making them reliable for strategic decisions. For high-volume sellers, enterprise platforms like PLOTT DATA, starting at $999 per month, cater to brands with over 1,000 SKUs across more than 60 marketplaces. These systems also include advanced features such as intelligent repricing, which can boost profits by up to 28% by adjusting prices during peak hours and managing inventory levels.
Review of BEST Amazon Profit Tracking Tools for 2025 (incl. Top FREE Software for Amazon Sellers)
How to Choose Between Built-In Dashboards and Third-Party Tools
Deciding between Amazon’s native analytics tools and third-party solutions depends on your business’s size, complexity, and data needs. Here’s a breakdown to help you make the right choice.
When Built-In Dashboards Are Enough
If you’re just starting out or running a lean operation, Amazon’s built-in tools can get the job done. For sellers making under $100,000 per month, managing fewer than 50 SKUs, and working solo, Seller Central’s dashboards are usually sufficient. These tools, paired with free access to Brand Analytics, are especially helpful for low-volume sellers who want to avoid extra subscriptions.
For new sellers, sticking to these free resources makes sense until your PPC (pay-per-click) spend surpasses 10% of your revenue. However, it’s worth noting that Amazon’s Custom Analytics Dashboard – introduced in late 2025 – lacks advertising data despite offering over 100 metrics. If your ad spend stays below $5,000 monthly and your operations remain straightforward, native reports should cover your needs for tracking sales, traffic, and conversion rates.
That said, as your ad spend and operational complexity grow, these tools may start to feel limiting.
When Third-Party Tools Make Sense
For businesses with expanding data needs, third-party tools often become essential. A common tipping point occurs when manual data compilation starts eating up too much time. If you’re spending hours each week pulling reports from Seller Central and organizing them in spreadsheets, it’s time to consider upgrading. Sellers generating $50,000 or more per month often face this challenge as their catalogs grow and PPC campaigns multiply.
One major advantage of third-party tools is competitor intelligence. Amazon’s dashboards only show your performance, leaving you in the dark about how you stack up against competitors. For example, tracking organic keyword rankings through third-party tools can help you benchmark your performance more effectively. These tools also shine when managing products across multiple regions or platforms, offering consolidated dashboards that save time and effort.
For sellers with high advertising budgets, third-party tools address critical blind spots like TACoS (Total Advertising Cost of Sale). TACoS measures ad spend relative to total revenue, and sellers who track this metric at the product level often see major improvements in their advertising ROI. For instance, in late 2025, a home goods brand generating $2 million annually used Nova’s Custom Analytics to link PPC data with cost of goods sold. They identified 12 SKUs with TACoS above 35% that were losing money, despite appearing profitable in Seller Central. By pausing those campaigns, they saved $45,000 annually and improved their overall TACoS from 17% to 14%.
Weighing Cost Against Value
The cost of third-party tools varies widely, but the potential savings often outweigh the expense. Entry-level tools like Sellerboard start at $19 per month for up to 3,000 orders, while mid-tier options like Jungle Scout begin at $49 per month. For larger operations, enterprise platforms like PLOTT DATA can cost $999 per month, designed for brands managing 1,000+ SKUs across multiple marketplaces.
To determine if a tool is worth it, consider your ad spend. For example, a seller with a $60,000 annual ad budget could save $13,800 with a 23% efficiency gain from better analytics – easily covering the cost of a $50 to $100 monthly subscription. The real hidden cost isn’t the tool itself but the fees you’re missing. A staggering 73% of Amazon sellers rely on incomplete profit tracking, missing out on over 200 fee types, including long-term storage and removal order fees. Ash Metry, Founder & CEO of Keywords.am, puts it bluntly:
"For a high-volume seller, missing 10-30% of these ‘hidden’ fees results in a Profit and Loss statement that is functionally fiction."
Third-party tools also save time – about 25 hours per month on average – that would otherwise go into manual data work. For instance, Sellerboard costs just $0.038 per order for 500 monthly orders, compared to $0.50 per order with Helium 10 Diamond. The key is to choose a tool that fits your actual needs, avoiding unnecessary features that inflate costs.
Conclusion: Selecting the Right Analytics Solution
Main Points from This Comparison
Finding the right analytics tool isn’t about choosing one over the other – it’s about aligning the tool with your current business needs and growth stage. Built-in dashboards, like Amazon’s Brand Analytics, provide basic insights at no cost but fall short when it comes to competitor data and real-time updates. They’re great for tracking sales, traffic, and conversions but lack the depth needed for nuanced profit analysis and detailed market insights.
On the other hand, third-party tools fill these gaps by offering advanced tracking capabilities, such as monitoring over 200 fee types and refreshing data as frequently as every 30 minutes. These tools are particularly useful for businesses managing complex PPC campaigns, scaling operations, or selling across multiple marketplaces. Many sellers take a hybrid approach – using Amazon’s free tools for basic data while relying on specialized platforms for deeper analysis, such as profit tracking and competitor monitoring.
The financial impact of these tools can be substantial. For instance, spending $50 a month on analytics software could lead to annual savings of up to $13,800 by improving ad efficiency by 23% on a $60,000 ad budget. Yet, about 73% of sellers still rely on incomplete profit tracking, which can result in misguided decisions. Investing in advanced analytics ensures you have accurate, actionable insights, which are crucial as your business grows and encounters more complex challenges. Understanding these distinctions highlights why the right analytics solution is a must-have for scaling effectively.
How Emplicit Helps You Use Analytics Effectively
Emplicit bridges the gap between raw data and actionable strategies, providing tools and expertise to help sellers make smarter decisions. Beyond generating reports, Emplicit keeps an eye on critical metrics like Buy Box percentage and seller feedback, helping you avoid sales dips. For PPC campaigns, they analyze ACoS data to cut wasteful spending and prioritize high-performing keywords.
What makes Emplicit stand out is its tailored strategic planning, driven by deep analytics. For example, through Market Basket Analysis, they uncover bundling opportunities to increase your average order value. Their inventory management services integrate native and third-party forecasting tools to prevent stock-outs, which could negatively impact your organic rankings.
With USA-based account managers and comprehensive support, Emplicit simplifies multi-marketplace analytics, allowing you to focus on growing your brand. Whether you’re just starting with Amazon’s free dashboards or managing operations across multiple platforms, Emplicit ensures you have the right data at the right time to make informed, impactful decisions.
FAQs
What’s the fastest way to tell if I’ve outgrown Seller Central dashboards?
If you’re wondering whether Seller Central dashboards are still meeting your needs, take a closer look at what they offer versus what your business demands. These dashboards are great for covering the basics – things like sales trends, traffic data, and account health. But as your business grows, you might find yourself needing more advanced tools to tackle challenges like competitor analysis, detailed performance tracking, or gaining deeper insights for strategic decisions. If the current setup feels restrictive or lacks the depth you need, it might be time to explore more advanced analytics solutions.
How can I calculate true net profit on Amazon (including COGS and hidden fees)?
To figure out your true net profit on Amazon, you need to factor in all expenses. This includes COGS (Cost of Goods Sold), Amazon fees, PPC advertising costs, promotions, and even returns. Once you subtract these from your gross sales, you’ll have a clear picture of your profitability.
It’s also worth using tools that can track Amazon-specific fees – like referral charges, fulfillment costs, and storage fees. These often-overlooked expenses can significantly impact your margins. By taking this detailed approach, you can better evaluate the performance of individual SKUs and gauge the overall health of your business.
Which metrics should I prioritize when my Amazon ad spend starts scaling?
When increasing your Amazon ad spend, it’s crucial to zero in on metrics that directly affect your profitability and efficiency. Pay attention to ACoS (advertising cost of sales) and ROAS (return on ad spend), as these metrics provide insight into your ad performance. Beyond that, keep an eye on impressions and clicks, which indicate how visible and engaging your ads are to potential customers. Finally, track conversion rates to see how well those clicks translate into actual sales. Together, these metrics help you fine-tune your strategy for better growth and profitability.