
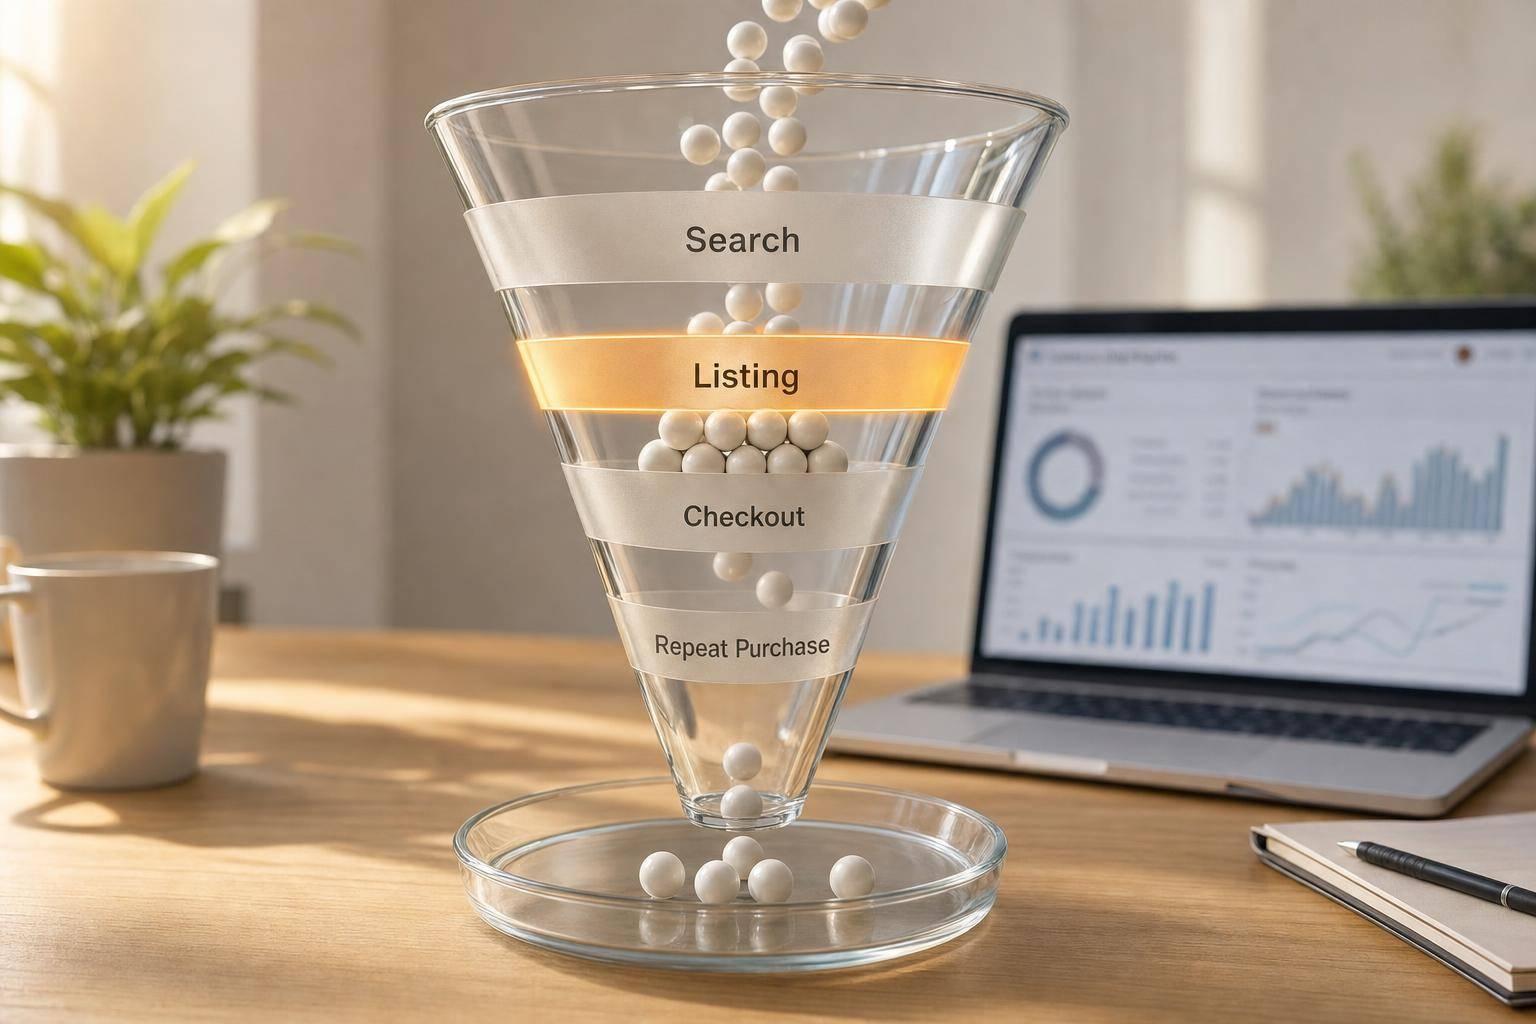
If Amazon sales slip, I first find where shoppers drop off: search, click, cart, purchase, or repeat purchase. That is the main job of Amazon Brand Analytics.
Here’s the short version:
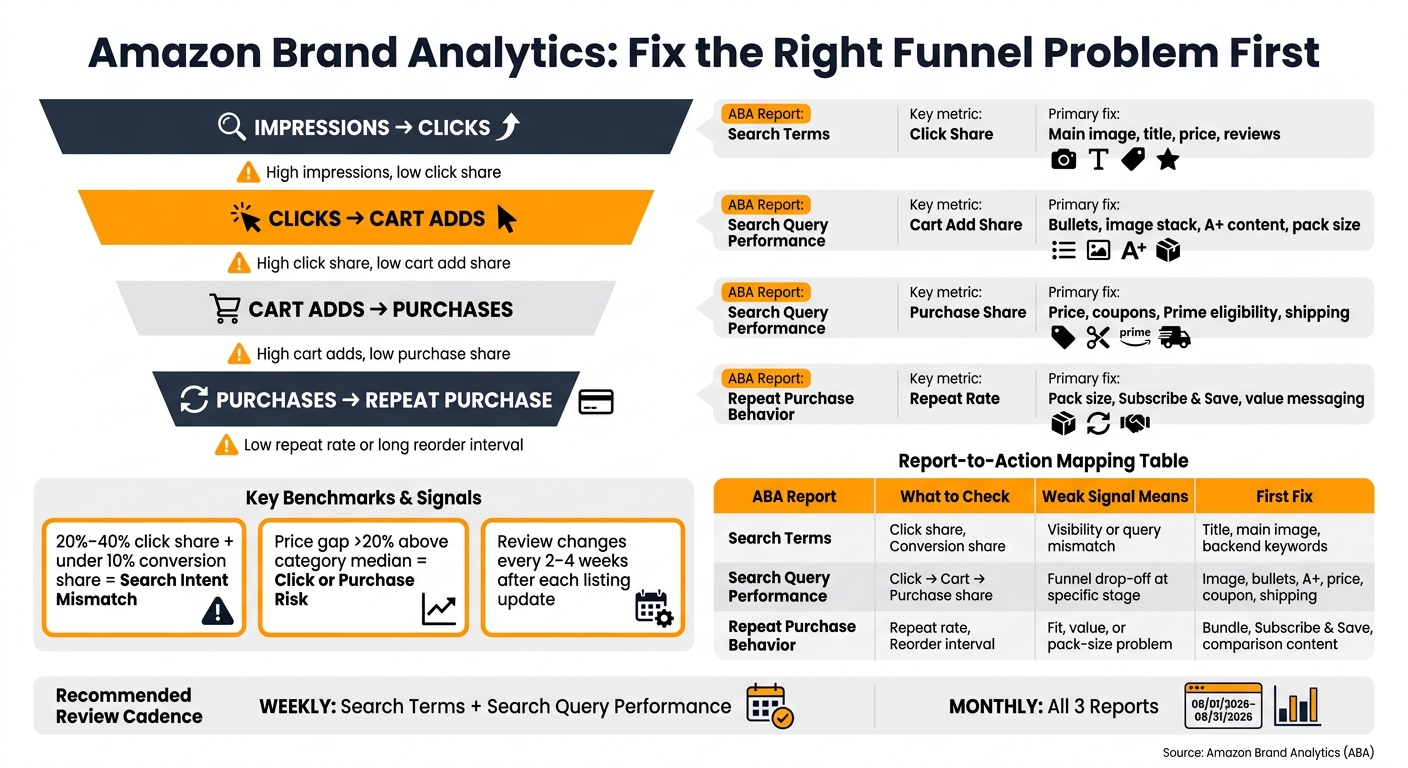
- Low click share usually means a search visibility problem.
- Low cart adds after clicks usually means the product page is not doing its job.
- Low purchases after cart adds usually points to price, shipping, Prime status, or stock issues.
- Low repeat purchase usually means product fit, pack size, or value is off.
I’d use the reports in this order:
- Search Terms: tells me if people find my listing and if the query matches the page.
- Search Query Performance: shows where people leave the funnel – impressions → clicks → cart adds → purchases.
- Repeat Purchase Behavior: shows if buyers come back and how long they wait.
A simple read looks like this:
| Report | What I check | What a weak number often means | What I’d change first |
|---|---|---|---|
| Search Terms | Click share, conversion share | Low visibility or poor query match | Title, main image, backend keywords |
| Search Query Performance | Click share, cart add share, purchase share | Search result issue, product page friction, or checkout friction | Image, title, bullets, A+, price, coupon, shipping |
| Repeat Purchase Behavior | Repeat rate, reorder interval | Weak fit, value problem, or wrong pack size | Size chart, comparison content, bundle, Subscribe & Save |
A few useful markers stand out in the article:
- 20%–40% click share with under 10% conversion share often signals search intent mismatch.
- A price gap above 20% versus nearby listings can hurt clicks or purchases.
- Review changes in 2–4 weeks after each update.
- Check Search Terms and SQP weekly and Repeat Purchase monthly.
- Use a clean month window like 08/01/2026–08/31/2026 for comparisons.
So if I had to sum up the article in one line, it would be this: fix the first weak step in the funnel instead of guessing.
The rest of the article explains how to read each report and match each pain point to the right next move.
Amazon Brand Analytics Funnel: Find & Fix Sales Drop-Offs
Use the Search Terms report to find discoverability and relevance problems
The Search Terms report shows the exact phrases shoppers use, along with search frequency rank, click share, conversion share, and the top-clicked ASINs. Put those numbers together, and you can usually tell whether the problem is visibility or relevance.
Low click share on high-volume terms means poor visibility
If a term gets strong demand but your ASIN has much lower click share than the top competitor, you likely have a visibility problem.
This usually happens for a few simple reasons. Your title may not line up with the query. Your main image may blend into mobile results. Or your listing may not index for the term because backend keywords are missing.
The fix starts with the title. Lead with the exact high-volume phrase, then add the key attributes shoppers care about – count, size, flavor, or material – inside the first 80 to 100 characters. Next, update the main image so it shows a clean, front-facing product shot that still reads well at thumbnail size. After that, add variants and synonyms to your backend search fields so the listing can index for more of the demand you’re missing.
High click share but low conversion share means mismatched search intent
When click share is high but conversion share stays low, the issue usually points to relevance or offer friction. In the Search Terms report, that often looks like 20% to 40% click share paired with under 10% conversion share on the same term. Common causes include intent mismatch, weak value proof, unclear sizing, or claims the detail page can’t back up.
Here’s a simple example. A shopper searches for "kids vitamin C gummies" and clicks your listing because the title is broad enough to match. But then the detail page leads with adult dosing, shows adult-focused imagery, and hides child-specific details lower on the page.
That gap hurts conversion. The fix is alignment. Your title, bullets, images, and A+ content should all match what the search term suggests. Be direct about the use case, target audience, pack size, and per-unit value. Use imperial measurements and plain language that U.S. shoppers expect.
Search term comparison table
Use the comparison below to separate visibility from relevance at a glance.
| Search Term | Search Frequency Rank | ASIN | Click Share | Conversion Share |
|---|---|---|---|---|
| vitamin C gummies | 1,250 | Brand ASIN A | 8% | 4% |
| vitamin C gummies | 1,250 | Competitor ASIN X | 32% | 28% |
| vitamin C gummies | 1,250 | Competitor ASIN Y | 18% | 16% |
In this example, Brand ASIN A trails both competitors on click share and conversion share. That points to a visibility problem first. The listing is not winning enough clicks, so there isn’t much conversion volume to work with yet.
If Brand ASIN A had much higher click share but conversion share still sat at 4%, the read would change. At that point, the issue would lean more toward relevance or product fit.
Use that read to decide which terms need listing fixes first.
Once Search Terms shows which queries underperform, use Search Query Performance to find where the funnel breaks after the click.
sbb-itb-e2944f4
Use Search Query Performance to find click, cart, and purchase drop-offs
After Search Terms flags weak queries, SQP helps you see where the shopper falls out of the funnel. Search Query Performance breaks the path into four stages for each search query: impressions, clicks, cart adds, and purchases. It shows both raw totals and your brand’s share at each step. The first big share gap usually tells you where the problem starts.
High impressions but low clicks point to a weak click-through rate
If impressions are high but clicks are low, shoppers are seeing your listing and picking something else from the results. That usually means the issue starts in search, not on the product detail page.
The usual suspects are pretty simple: a main image that looks weak at thumbnail size, a title that buries the main selling point, a star rating under 4.0, or a price that feels off compared with nearby listings.
In most cases, the fix is a stronger image, a tighter title, or a better offer. In other words, fix what the shopper sees before they click.
To improve click share:
- Put the exact query phrase and the most relevant spec near the front of the title, ideally within the first 60 to 80 characters. That could be pack size, material, or the main benefit.
- Make sure the main image is easy to read at small sizes and has enough contrast to stand out.
- If your price is more than 20% above the category median and there’s no clear reason why, test a coupon or limited-time deal to make the offer more competitive in search.
Clicks without cart adds point to detail page friction
If click share looks healthy but cart add share is weak, shoppers are interested enough to visit the listing but not sold enough to add it to cart. That gap usually sits on the detail page.
Sometimes the product simply doesn’t match what the query suggests. If the pack size or use case feels off, the click won’t turn into a cart add. Weak bullets, poor image order, thin A+ content, or a pack size that clashes with query intent are the most common reasons.
A single-serve search that lands on a 6-pack listing with unclear per-unit value usually loses the cart add.
That’s why it helps to audit the image stack, bullets, and pack size against the query itself. If the search implies one thing and the page shows another, shoppers bail.
Cart adds without purchases point to offer or checkout friction
Cart adds without purchases usually mean offer or checkout friction. In SQP, that shows up as solid cart add share paired with weak purchase share for the same query.
The common causes are price hesitation at checkout, no Prime eligibility, a slow delivery window, or a temporary stock-out. By the time shoppers reach the cart, they’re often comparing your item against others they’ve added too. A small price gap or a weaker shipping promise can be enough to lose the sale.
The table below links each funnel drop-off to its likely cause and the lever most likely to fix it.
| Funnel Drop-Off | What SQP Shows | Common Cause | Primary Fix |
|---|---|---|---|
| Impressions → Clicks | High impression share, low click share | Weak image, title, price, or reviews | Main image refresh, title front-load, coupon or visible badge |
| Clicks → Cart Adds | High click share, low cart add share | Weak detail page content, wrong pack size, thin A+ | Bullet rewrite, image sequencing, A+ content upgrade |
| Cart Adds → Purchases | High cart add share, low purchase share | Price gap, slow shipping, stock-out, no Prime | Coupon or price cut, shipping or inventory fix |
Start with the biggest gap first.
Use Repeat Purchase data to find retention problems
After the first sale, the next thing to check is simple: do shoppers come back? Repeat Purchase Behavior shows whether the customers you worked to win are buying again.
If repeat purchase rate is low, that often points to problems with product fit, value, or pack size. If reorder intervals are longer than expected, that can point to pack-size or pricing issues. Put those two signals together, and you can usually tell whether the problem is loyalty, replenishment timing, or value perception. That matters because each problem needs a different fix.
Low repeat purchase rate can signal product-fit or value issues
When repeat purchase rate is low, add a final A+ module that answers the main objections in 1-3 star reviews. This gives shoppers the missing context before they buy.
Low repeat purchase and high returns often come from expectations not matching the product. To cut that risk, add a scale or size reference image and a comparison chart to the listing. Small details like this can clear up confusion fast.
Long reorder intervals can reveal pack size or pricing misalignment
A longer-than-expected reorder interval can mean a few things. Shoppers may be stretching a pack longer than you planned. They may be switching to a competitor before they run out. Or they may feel the per-unit price is too high to reorder sooner.
Check whether your pack size matches how people usually use products in that category. If it doesn’t, test a larger bundle or a Subscribe & Save option to help close the gap.
Product-level repeat purchase table
Use the table below to spot retention problems at the ASIN level before deciding where the fix belongs.
| Product | Repeat Purchase Rate | Reorder Interval | Likely Issue |
|---|---|---|---|
| ASIN A | 12% | 68 days | Low loyalty; value or fit problem |
| ASIN B | 31% | 45 days | Healthy rate; monitor for pack-size drift |
| ASIN C | 8% | 90 days | Pricing or pack-size misalignment |
Use these signals to decide whether the fix belongs in content, pricing, or replenishment. Once you find the retention gap, map it to the right listing, pricing, or ad change.
Turn report findings into listing, pricing, and ad changes
Once you know where shoppers drop off, the next step is simple: turn each signal into a fix.
A repeatable weekly and monthly optimization workflow
Review Search Terms and SQP every week. Review Repeat Purchase once a month.
Each week, export SQP for your top 20 revenue-driving ASINs. Look for queries with high impression share but weak click share. Also look for queries with strong click share but weak cart or purchase share. Then document 3–5 changes and check results in 2–4 weeks.
Once a month, pull all three reports using a clean calendar window – for example, 08/01/2026–08/31/2026 – and compare that period against the prior month. Use Search Terms to spot high-volume queries with low click share. Then confirm in Repeat Purchase that the ASINs you’re pushing keep buyers coming back. A fixed review schedule and a short ASIN list make this process easier to manage.
Match each pain point to the right fix
Once the pain point is clear, move from diagnosis to action. Use the table below to send each issue to the right owner.
| Area | ABA Metric to Watch | Common Pain Point | Key Lever | Team Owner |
|---|---|---|---|---|
| Discovery | Search Terms click share | Low brand clicks on high-volume queries | Title, main image, keyword optimization | Ecommerce / Content lead |
| Detail Page | Clicks → Cart adds | Shoppers click but rarely add to cart | Images, bullets, A+ content, reviews | Content / Creative lead |
| Checkout | Cart adds → Purchases | Strong cart adds but weak purchase conversion | Pricing, coupons, bundles, shipping | Ecommerce / Pricing lead |
| Retention | Repeat purchase rate and reorder interval | Few repeat buyers or long gaps between orders | Pack size, Subscribe & Save, value messaging | Product / Brand manager |
Assign an owner and a due date to each lever you decide to pull. That step is what turns an insight into a change that actually ships.
How Emplicit can help you act on ABA insights
Reading ABA reports is easy. Turning them into PPC, content, pricing, and inventory changes is where things get tough.
If your team needs help with execution, Emplicit can connect report findings to action. That includes paid campaigns, listing updates – titles, bullets, images, and A+ content – tied straight to the discovery and detail page issues the reports surface. Emplicit can also help with price positioning, bundle structures, and coupon cadence, while lining up inventory and account health management so high-potential ASINs stay in stock and compliant.
Conclusion: Fix the right problem first with ABA reports
Most Amazon sellers lose sales for a simple reason: they fix the wrong thing first.
They tweak listings when the problem is pricing. They pull back on ads when the main image is the weak spot. Amazon Brand Analytics helps cut through that noise. It shows where shoppers stop moving forward – at search, on the detail page, at checkout, or after the first purchase.
Once you spot where the drop-off begins, each report tells you what to work on. Search Terms shows search visibility. SQP shows click-to-purchase drop-offs. Repeat Purchase shows what happens after the first order.
Then it’s about acting on the signal and checking results in 2–4 weeks. If a seller sees low click share on a high-volume query, the answer isn’t to instantly cut prices or pour more money into ads. A better move is to find the exact stage that’s failing, make one or two focused changes – like a new hero image, a clearer title claim, or a targeted coupon – and then see whether click share or purchase share changed.
Used this way, ABA can work for one ASIN or an entire portfolio. It works for any brand because it tracks shopper behavior, not company size.
The process is simple: identify the signal, trace it to a funnel stage, fix it, and measure the result.
FAQs
Which ABA report should I check first?
Start with the Search Query Performance dashboard in Amazon Brand Analytics. It gives you Amazon first-party data on impressions, clicks, add-to-cart actions, and conversion rates.
Use it to find keywords with high purchase rates but low brand share. Those terms can point to demand you’re not fully winning yet.
It also helps you spot high-click, low-conversion queries. That’s often a sign that something’s off on the listing side – like weak content, unclear images, poor reviews, or pricing that doesn’t line up with shopper expectations.
How do I know if the problem is search visibility or product-page conversion?
Check the Search Query Performance dashboard and the Detail Page Sales and Traffic Report.
If impressions are high but click-through rate is low, shoppers are seeing your product but not clicking on it. That points to a search visibility problem.
If clicks are strong but Unit Session Percentage is low, shoppers are finding your product but not buying it. That points to a product-page conversion problem.
How long should I wait before measuring results after a change?
It depends on the type of change.
For ad campaigns, wait 7 to 30 days before you change budgets. That gives you enough time to spot actual trends instead of reacting to short-term swings.
For new keywords, give them 14 to 21 days. You need enough data to see if they convert at a cost you can live with.
For general performance changes, use a 14-day test window. You can also look at rolling 7- or 14-day windows to account for Amazon’s 24- to 48-hour attribution delay.