
Your Amazon sales data holds the key to boosting your profits, but many sellers miss critical insights by focusing on the wrong metrics. Revenue numbers might look impressive, but hidden inefficiencies – like high FBA fees, poor conversion rates, and untracked ad spend – can quietly eat away at your margins. Here’s what you need to know:
- Buy Box Ownership: 82% of Amazon sales come from the Buy Box. Monitor your percentage to avoid losing sales.
- Conversion Rates: Strong listings convert at 12% or higher. A drop in conversions signals issues with pricing, content, or competition.
- Inventory Management: Avoid stockouts (which harm rankings) and overstocking (which increases fees). Keep your IPI score above 350.
- Return Analysis: Track return reasons. High return rates (over 8% for most products) can lead to refund fees and account health risks.
- Ad Spend: High ACOS or rising TACoS with flat sales means your ad spend could be eating into profits.
Amazon Sales Data Analysis: How to Gain Business Insights from Your Data
The Data Points You’re Ignoring
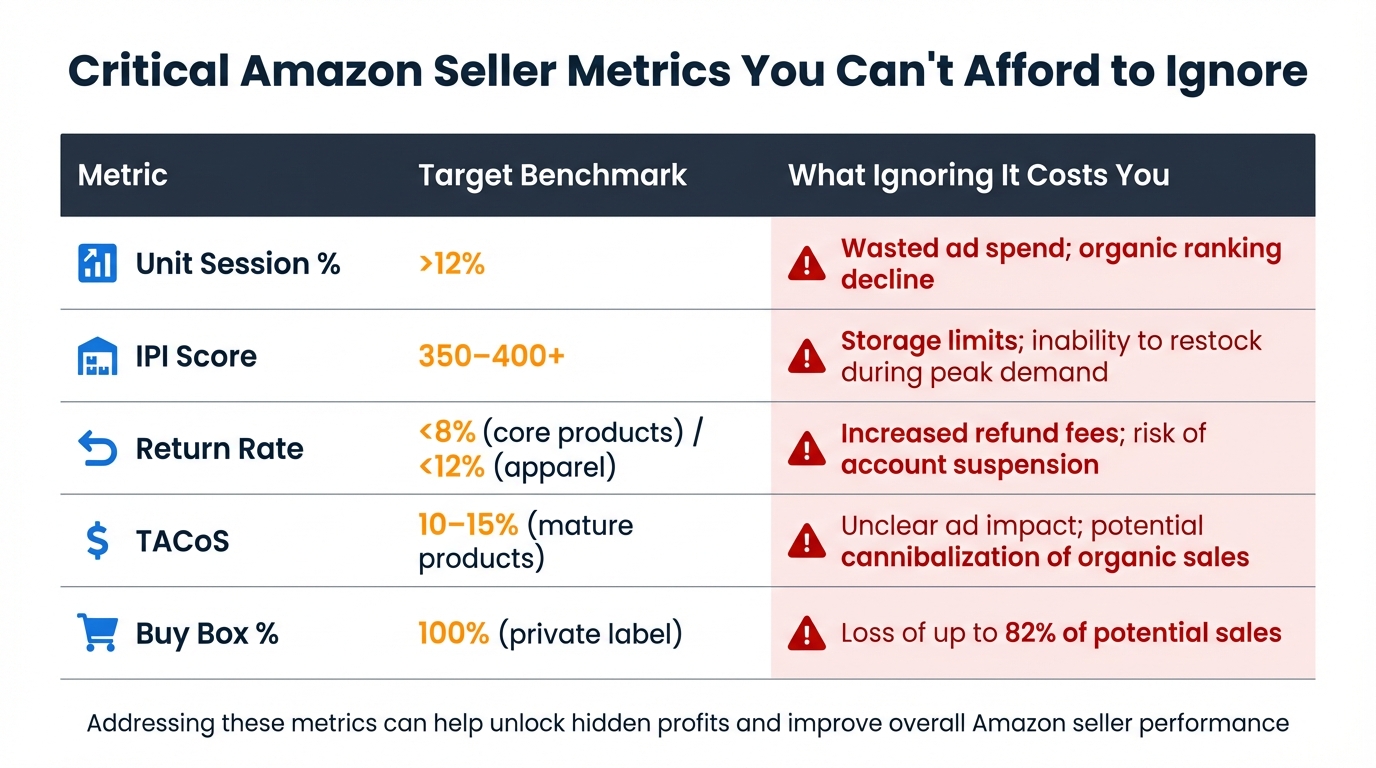
Critical Amazon Seller Metrics: Benchmarks and Costs of Ignoring Them
Most sellers focus on tracking total sales, but some key metrics often fly under the radar. These overlooked data points can reveal hidden issues that impact profit margins and overall performance.
Conversion Rates: High Traffic, Low Sales
The average conversion rate hovers around 9.87%, with strong listings hitting 12% or more. If you notice a 20% drop in conversions week-over-week, it could point to problems with pricing, Buy Box ownership, or listing content. High traffic paired with low sales often signals a weak listing. Keep in mind that 75% of online shoppers base their purchasing decisions on reviews and ratings.
Inventory Imbalances: Stockouts and Overstock
Inventory mismanagement can hurt in multiple ways. Stockouts not only lead to missed sales but also harm your organic ranking and Inventory Performance Index (IPI). If your IPI dips below 350–400, Amazon may enforce storage limits. On the flip side, overstocking can lead to long-term storage fees, especially for items sitting in FBA warehouses for over 90 days. These fees can quietly chip away at 1–3% of your margins. Another issue to watch for is stranded inventory – products stored in Amazon warehouses without an active listing. These items rack up fees without generating any sales.
Return Rates and Customer Feedback Trends
If your return rate exceeds 8% for core products or 12% for apparel, it’s a red flag. Many sellers focus on the sheer number of returns but fail to analyze the reasons behind them. Amazon’s Voice of the Customer (VOC) dashboard and return reason codes (like "not as described" or "defective") can pinpoint issues that need fixing. Ignoring these trends can lead to higher refund fees and push your Order Defect Rate (ODR) closer to the critical 1% threshold, putting your account health at risk.
Ad Spend Inefficiencies: High ACOS
Over 70% of sellers using PPC doubt whether their campaigns are profitable. If your Advertising Cost of Sales (ACOS) surpasses your profit margin, you’re losing money on every ad-attributed sale. To get a clearer picture, monitor Total Advertising Cost of Sales (TACoS). A rising TACoS with flat overall sales suggests that your ad spend is eating into organic sales. Additionally, a Click-Through Rate (CTR) below 0.3% indicates that your ad creative or targeting needs improvement.
Stagnant Average Order Value (AOV)
A stagnant Average Order Value (AOV) is a missed opportunity to increase profits with minimal effort. By encouraging bundle purchases or promoting complementary products, you can boost AOV without significant additional costs. Amazon’s Market Basket Analysis report can help you identify which products are frequently bought together, offering insights for effective cross-selling strategies. Using this data strategically can help you enhance your listings and improve profitability.
| Metric | Target Benchmark | What Ignoring It Costs You |
|---|---|---|
| Unit Session % | >12% | Wasted ad spend; organic ranking decline |
| IPI Score | 350–400+ | Storage limits; inability to restock during peak demand |
| Return Rate | <8% (core) / <12% (apparel) | Increased refund fees; risk of account suspension |
| TACoS | 10–15% (mature products) | Unclear ad impact; potential cannibalization of organic sales |
| Buy Box % | 100% (private label) | Loss of up to 82% of potential sales |
This table summarizes the key metrics you should be tracking, the benchmarks to aim for, and the potential costs of neglecting them. Addressing these areas can help you unlock hidden profits and improve your overall performance.
How to Fix These Problems
Improving Conversion Rates
Amazon’s Search Catalog Performance dashboard is your go-to tool to identify where shoppers lose interest. If you’re seeing high impressions but few clicks, it’s time to enhance your main image and title. On the other hand, if clicks are strong but conversions are low, you might need to revisit your product descriptions, pricing, or A+ Content. Also, double-check that your traffic-driving keywords match what your product truly offers. For example, if customers search for "waterproof hiking boots" but your listing emphasizes "lightweight design", this mismatch could explain the low conversion rates.
Analyzing hourly performance trends can uncover bottlenecks that, when addressed, can lead to noticeable sales boosts. Pay close attention to products where the Unit Session % drops by 20% or more week-over-week – this is a red flag that warrants an immediate listing review.
Once you’re on track with conversions, the next step is to ensure your inventory levels are in sync with demand.
Balancing Inventory Levels
Calculating the right reorder point is essential to avoid running out of stock or overstocking. The formula is straightforward: Reorder Point = ((Production Time + Shipping Time) x Daily Sales Velocity) + Safety Stock. Safety stock, ideally about 30% of your target days of stock, acts as a buffer for unexpected delays or demand spikes.
Keep an eye on your Inventory Performance Index (IPI). If it falls below 350–400, Amazon might impose storage limits, which could disrupt your ability to restock during busy seasons. For slow-moving items that rack up storage fees, consider creating removal orders or using Amazon Outlet to clear them out and free up cash for better-performing products. Weekly audits comparing your records with Amazon’s FBA Inventory reports can also help you catch discrepancies early.
With inventory in check, you can shift focus to reducing returns and improving customer satisfaction.
Reducing Returns and Negative Feedback
The Voice of the Customer (VOC) dashboard and return reason codes are invaluable for spotting trends. If customers frequently mention "too small/large", you may need to revisit your size guide. Similarly, repeated "defective" complaints might point to a supplier quality issue. Don’t just count returns – dig into the reasons behind them.
For "not as described" returns, updating size charts or adding packaging disclaimers (like "box ships compressed") can set clearer expectations. Sellers who adopt this "Returns Loop" approach often see up to a 15% drop in returns within two months.
Also, compare return rates across product variations. Sometimes, a single size or color drives most issues. Removing that problematic variation can improve overall performance.
Optimizing Advertising Campaigns
Segment your campaigns by product, match type (broad, phrase, or exact), and goal (e.g., launch, profitability, or ranking). This makes your data more actionable. Instead of reacting to daily changes, use rolling 7-day or 14-day windows to account for Amazon’s attribution delays.
For example, in Q1 2023, the brand Naturediet partnered with Acorn-i to implement rapid retail analytics. By monitoring hourly traffic and sales and making intraday adjustments, they achieved a 27% boost in ROAS and cut campaign optimization time by 90%.
Regularly audit search term reports to identify high-converting queries. Move these into manual "Exact Match" campaigns for greater control. If your click-through rate (CTR) falls below 0.3%, review your ad image, title, and targeting. Also, add poorly performing or high-spend terms as negative keywords to avoid wasting your budget. Use placement bid multipliers strategically – if "Top of Search" placements perform better than "Rest of Search", consider increasing bids by 50–100% to secure those valuable spots.
Focus on TACoS (Total Advertising Cost of Sale) rather than just ACOS. TACoS measures ad spend against total revenue (including organic sales). A declining TACoS with rising total sales indicates that your ads are driving long-term organic growth.
With ad campaigns optimized, you can turn your attention to increasing the average order value.
Increasing Average Order Value (AOV)
Amazon’s Market Basket Analysis report is a powerful tool to identify products frequently purchased together. Use this insight to create Virtual Bundles or highlight complementary items in your A+ Content. For instance, if customers often buy phone cases and screen protectors together, consider bundling them or prominently featuring the screen protector in your listing.
Experiment with different bundle configurations to find combinations that increase AOV without leading to higher return rates.
sbb-itb-e2944f4
Step-by-Step Guide: Using Emplicit to Analyze Data
How to Access and Segment Seller Central Reports
Using Seller Central data effectively can help uncover insights that drive profitability. Start by navigating to the Reports tab in Seller Central, where you can access Business, Advertising, and Fulfillment Reports. From there, segment the data by ASIN, SKU, or category to pinpoint which listings are excelling and which need improvement.
Make it a habit to review these reports regularly – daily, weekly, monthly, and year-over-year (YoY). This approach helps you spot trends and seasonal shifts. One report to pay special attention to is the Search Term Report, which highlights keywords that are driving conversions and those that might be wasting your ad spend. By breaking down this data, you set the stage for more precise adjustments with Emplicit.
Using Emplicit for Inventory and PPC Optimization
Emplicit simplifies inventory forecasting and ad budget management. It integrates seamlessly with your existing data, making it easier to identify fast-moving products versus aging stock. The platform also tracks inbound FBA shipments, so you’ll always know when inventory is expected to arrive at fulfillment centers.
For PPC (Pay-Per-Click) campaigns, Emplicit takes the guesswork out of optimization. It pulls high-performing keywords from your Search Term Report and organizes them into manual "Exact Match" campaigns, giving you greater control over ad performance. It also weeds out irrelevant keywords to cut down on wasted ad spend. Sellers who adopt these automated workflows often recover between 3% and 7% of lost profit within 90 days.
Comparing Metrics Before and After Optimization
Once you’ve implemented changes, it’s essential to track your progress. Start by creating a table to log baseline metrics before making any adjustments. Focus on critical indicators like Unit Session Percentage (conversion rate), ACOS (Advertising Cost of Sale), return rate, and Buy Box percentage. Use rolling windows of 7 or 14 days to account for Amazon’s attribution delays – sales from today’s clicks may take 24–48 hours to appear.
Run tests over a 14-day period to ensure the results are statistically meaningful. Pay close attention to your Total Advertising Cost of Sale (TACoS) alongside ACOS. A lower TACoS, paired with rising overall sales, signals that your ads are driving organic growth effectively. Regular weekly audits can help you stay ahead of new trends and confirm that your optimizations are delivering the desired return on investment.
Advanced Strategies: Routine Audits and Brand Analytics
Conducting Weekly Data Audits
Many sellers only dive into their numbers when something seems off – and by then, the damage is often done. Shifting to weekly audits can turn scattered data into a proactive system that catches problems before they eat into profits. Focus on these seven key areas: Business Reports to track sales trends, Inventory to spot stockouts or aging products, Performance Notifications for account health updates, Advertising to monitor ACoS and ROI, Search Query Performance to understand customer intent, Returns to flag product defects, and Fee Previews to protect your margins.
Set a regular cadence for these reviews – check conversion rates weekly, returns every two weeks, and FBA fees along with stranded listings monthly. This routine helps you spot "micro-creep" – small, incremental changes like slight packaging tweaks that can unexpectedly increase fulfillment fees. It also allows you to catch ASINs with a 20% or more weekly drop in Unit Session Percentage early on.
Once you’ve identified trends or potential issues through audits, you can leverage brand analytics to refine your strategy and uncover deeper insights into customer behavior.
Using Brand Analytics for Geographic and Search Insights
Weekly audits can reveal performance gaps, but brand analytics take it a step further by highlighting regional and keyword-specific opportunities. If you have a Professional selling account on Amazon (priced at $39.99/month), you gain access to Amazon’s Brand Analytics tools. These tools are a goldmine for understanding what customers search for before landing on your products. For instance, the Search Query Performance dashboard shows your brand’s share of impressions, clicks, and conversions for specific keywords in comparison to the total market. Keywords with high click share but low impression share often signal untapped demand, making them ideal candidates for increased PPC bids.
Take this example: Guy Arad, Co-Founder of thefitguy, optimized his listings using high-performing search terms and saw his quarterly sales jump by over 40%. Similarly, the Market Basket Analysis report reveals which products are frequently purchased together, opening up opportunities for bundling. Jason Panzer, President of HexClad, noted that this data can fuel effective cross-selling and upselling strategies. For more detailed insights, switch from "Brand View" to "ASIN View" in your reports to zoom in on individual product performance. Meanwhile, the Demographics dashboard provides a snapshot of customer data – like age, income, and education – helping you fine-tune your A+ Content and advertising visuals.
Scaling with Emplicit’s Enterprise Plan
As your Amazon business expands across multiple marketplaces, managing data from various channels can become overwhelming. That’s where Emplicit’s Enterprise Plan steps in, ensuring your scaling efforts remain as precise as your weekly audits. This platform supports omnichannel growth across Amazon, TikTok Shops, Walmart, and Target, offering full-service team support and USA-based account managers.
Emplicit’s Enterprise Plan centralizes everything – inventory forecasting, PPC optimization, and account health management. Whether you’re aiming for $10M in annual revenue or juggling hundreds of SKUs, this solution provides tailored strategies to help you grow. It’s particularly handy when your weekly audits uncover opportunities that require immediate action across multiple platforms simultaneously.
Conclusion: Turning Data Into Profit
Your Amazon data isn’t just numbers on a screen – it’s a guide to improving margins and boosting profitability. Throughout this discussion, we’ve highlighted the key metrics and practical steps needed to transform your business. The main difference between sellers who struggle and those who succeed often boils down to one thing: having clear, unified access to data. When reports for ads, FBA fees, and returns are scattered across multiple platforms, it becomes nearly impossible to spot profit opportunities.
Sellers who commit to integrating data into their workflows can recover lost profits in as little as 90 days by addressing critical benchmarks like conversion rates, inventory issues, return trends, ad spend inefficiencies, and stagnant average order values (AOV). By focusing on these areas, you can create a steady foundation for consistent margins.
Shifting from intuition to data-driven decisions doesn’t require a deep understanding of analytics – it just takes regularity. Consistent reviews of metrics like Unit Session Percentage and return rates can help you catch problems early. For instance, a 20% drop in conversions might signal increased competition, or gradual changes in packaging could push you into higher FBA fee tiers without you even realizing it.
Keep in mind, 82% of Amazon sales happen through the Buy Box, and 70% of search traffic stays on the first page. Your data shows you exactly where you stand and what needs attention. Whether it’s reallocating ad budgets, improving product descriptions to reduce returns, or addressing stranded inventory before it hurts sales, every action you take builds toward long-term gains.
The tools and insights you need are already available. By auditing your data regularly and acting on what it reveals, you can build a business that not only survives but thrives in a competitive marketplace. Use your data wisely, and you’ll see the results in your bottom line.
FAQs
How can I increase my Amazon conversion rate?
Boosting your Amazon conversion rate is all about turning more browsers into buyers, which directly influences your sales and product ranking. The formula is simple: (purchases ÷ page views) × 100. For instance, if 100 people visit your page and 5 make a purchase, your conversion rate is 5%. Even small tweaks can make a big difference.
Here’s where to focus your efforts:
- Optimize your product listing: Start with high-quality images (at least 1,000 pixels on the longest side) to highlight your product’s details. Write clear, keyword-rich titles and use bullet points to showcase the most important benefits. If eligible, add A+ Content to your detail page – this can include visuals like lifestyle images or comparison charts to make your product stand out.
- Price competitively: Regularly check your competitors’ pricing and consider offering limited-time discounts or promotions. These strategies can attract shoppers who are sensitive to price.
- Build trust with reviews: Leverage Amazon’s tools to request customer feedback. Respond to questions promptly and address negative reviews professionally. Positive reviews and timely responses can significantly improve your credibility.
- Attract the right audience: Use Amazon ads like Sponsored Products or Sponsored Brands to reach shoppers already searching for items like yours. Keep an eye on your ad performance to ensure you’re targeting the right audience and converting clicks into sales.
- Analyze your data: Dive into Amazon’s Business Reports to track metrics like "Session %" (conversion rate) and "Page Views." If a product has high traffic but low conversions, tweak its listing or pricing. For items with strong conversion rates but limited visibility, consider increasing your ad budget to drive more traffic.
By fine-tuning your product listings, pricing strategies, customer interactions, and ad campaigns – and staying on top of your data – you can steadily improve your conversion rate and grow your sales on Amazon.
What are the most important metrics for managing Amazon inventory effectively?
To keep your Amazon inventory running smoothly, it’s crucial to monitor a few important metrics that ensure you have the right stock levels while boosting performance:
- Inventory Performance Index (IPI): This score indicates how well you’re managing your inventory, factoring in things like sell-through rates, excess stock, and in-stock percentages. Keeping your IPI above 500 helps you avoid storage penalties and keeps operations efficient.
- Sell-through Rate: This metric shows how quickly your inventory is selling compared to the stock you have on hand. A strong sell-through rate not only avoids long-term storage fees but also signals healthy inventory turnover.
- Stockout Rate: This tracks how often you run out of stock. Frequent stockouts can hurt your chances of winning the Buy Box and negatively impact your rankings. Staying on top of this ensures you’re replenishing inventory at the right time.
Paying attention to these metrics can help you cut storage costs, prevent stockouts, and boost your sales performance on Amazon.
How can I make the most of my Amazon ad budget?
To get the most out of your Amazon ad budget, it’s crucial to focus on profitability rather than simply chasing clicks. Start by diving into your campaign and keyword performance. Pinpoint high-margin keywords that drive profitable sales, and shift more of your budget toward them. At the same time, scale back or pause bids on keywords that aren’t delivering results. Keep an eye on essential metrics like ACoS (Advertising Cost of Sales), ROAS (Return on Ad Spend), and conversion rates, and compare these to your breakeven ROAS to ensure your efforts are profitable.
Don’t stop at surface-level data like clicks – dig deeper into metrics such as conversion rates, average order value, and profit per sale to spot any hidden inefficiencies. Consider using strategies like dayparting, which allows you to concentrate your ad spend during the times that generate the best results. Adjust your bids weekly based on performance trends to stay responsive to changes. By consistently fine-tuning your campaigns, you can make sure your ad spend aligns with your profitability goals, steering clear of wasted resources on underperforming campaigns.