
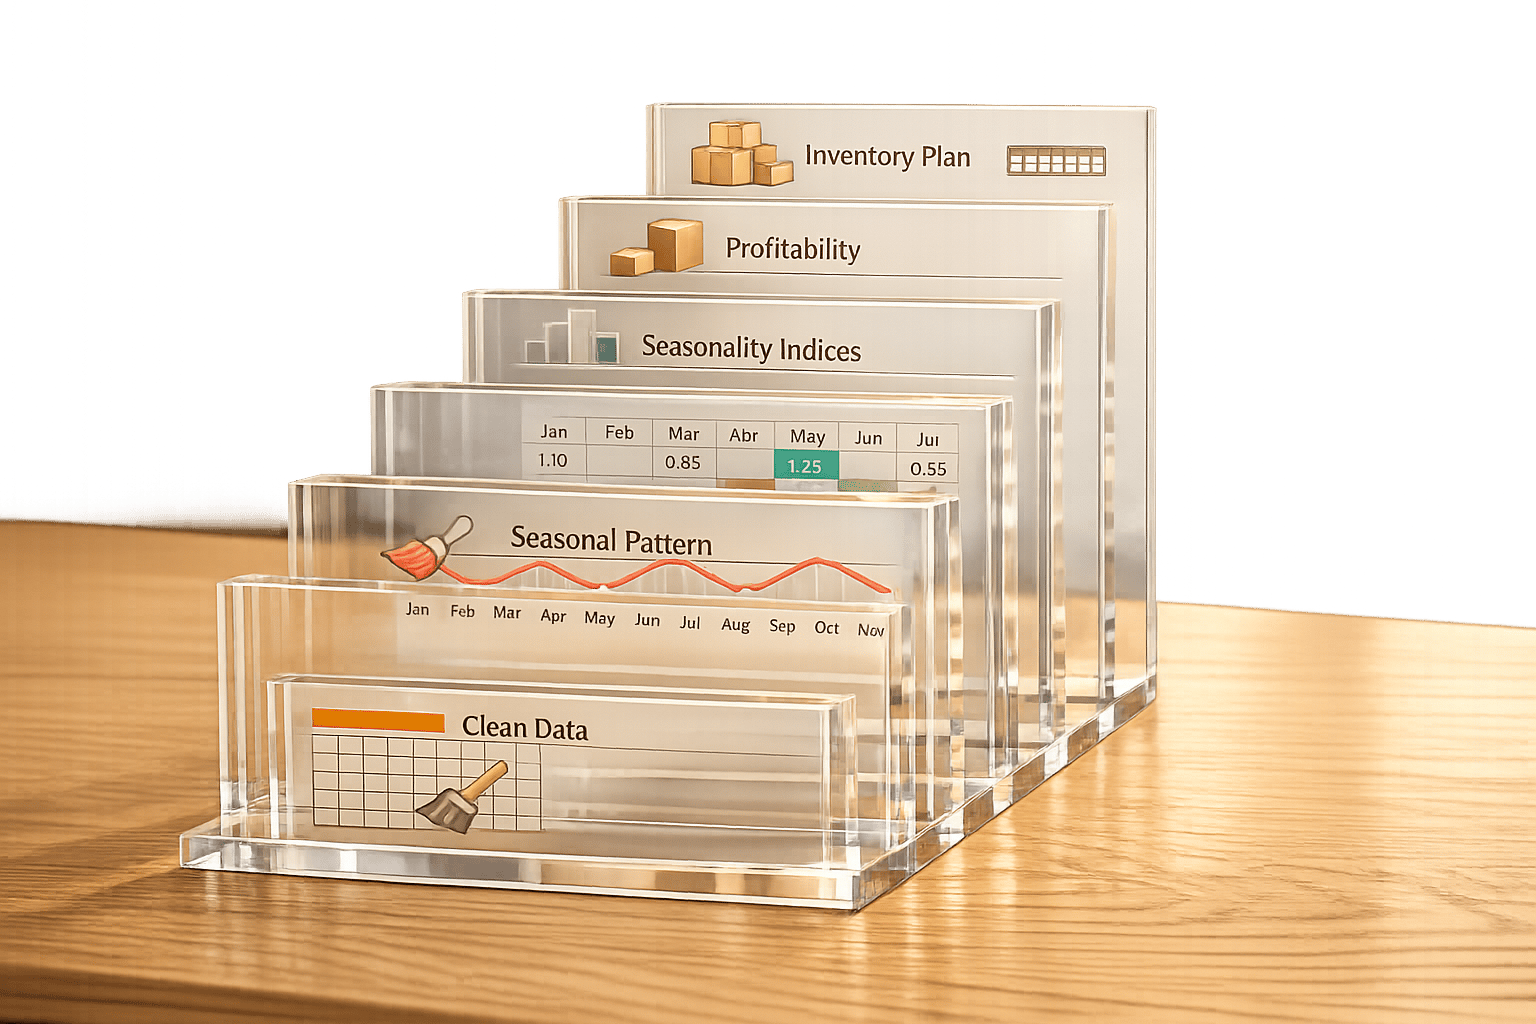
Understanding seasonal sales trends can help you predict demand, avoid stock issues, and maximize profits during peak periods. Here’s a quick breakdown of how to analyze and act on these trends:
- Collect Historical Sales Data: Gather 2–3 years of detailed sales data, clean it, and organize it for analysis. Include metrics like units sold, revenue, and promotional history.
- Define Seasonal Periods: Identify key sales periods (e.g., holidays, tax refund season) and segment your data by product, region, or customer type to uncover patterns.
- Calculate Seasonality Indices: Use these to measure how specific periods perform compared to the average. Tools like moving averages or AI-powered platforms can refine your analysis.
- Assess Profitability: Analyze which seasons drive revenue and profit. Track metrics like gross margin, basket value, and stock turnover to understand your true performance.
- Create Action Plans: Use insights to forecast demand, plan inventory, and optimize marketing campaigns. Adjust strategies for peak and slow periods to ensure consistent growth.
Key takeaway: Seasonal trends are predictable opportunities. By planning ahead and using data-driven strategies, you can boost sales, manage inventory efficiently, and avoid costly mistakes.
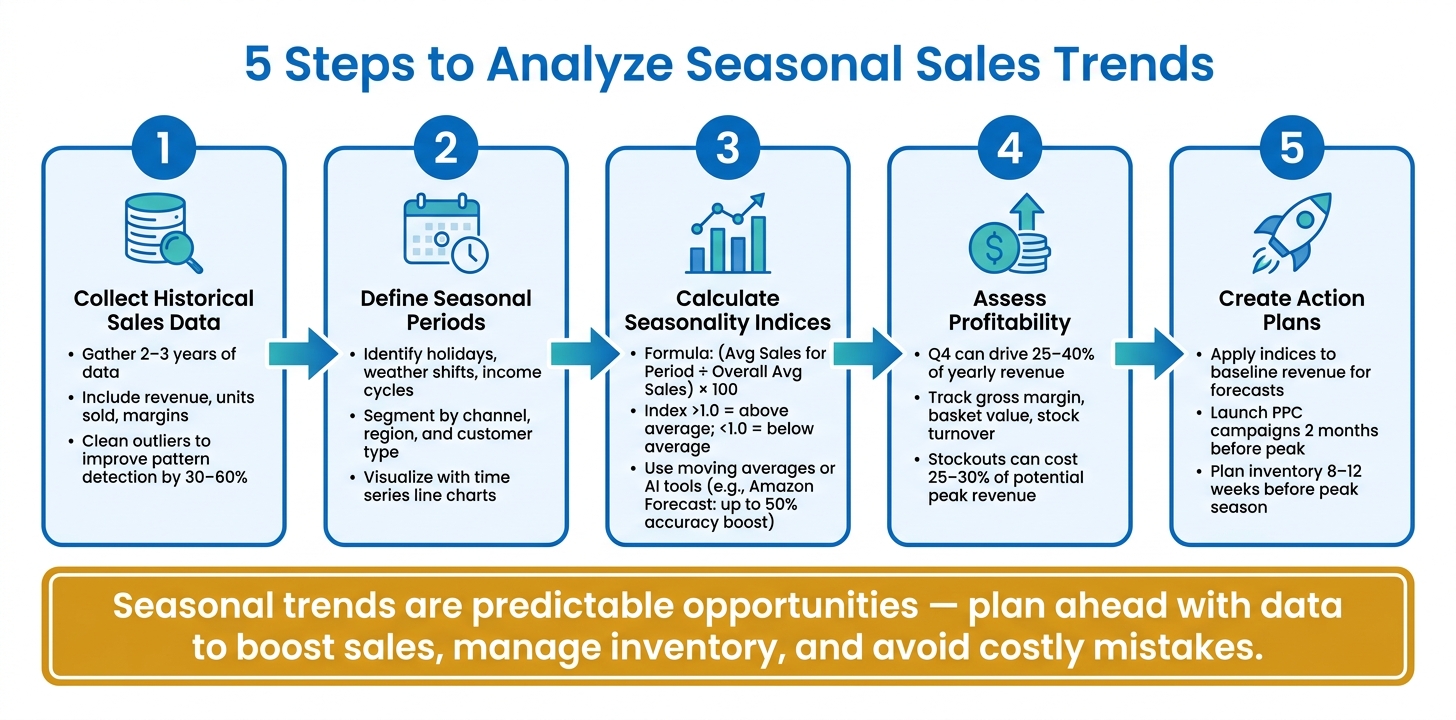
5 Steps to Analyze Seasonal Sales Trends
Seasonal Demand Forecasting Simplified With Excel
sbb-itb-e2944f4
Step 1: Collect and Organize Historical Sales Data
To confirm patterns, you need enough data to work with. A single year of sales data won’t cut it – it might be skewed by unusual circumstances like supply chain issues or viral trends. Aim for 2–3 years of historical data to spot trends that repeat across multiple cycles rather than being one-off events.
How Much Data to Gather
Go beyond just total revenue. Your analysis should include:
- Financial metrics: revenue, gross margin, average order value.
- Sales volume: units sold, sales velocity.
- Traffic insights: sessions, conversion rates, and channel-specific data.
- Operational details: inventory levels, pricing adjustments, and promotional history.
Dive into the SKU or variant level for deeper insights. Relying solely on overall averages can hide important details about what’s driving seasonal peaks.
Cleaning and Standardizing Your Data
Start by plotting your historical data on a line chart. This makes it easier to spot and address anomalies like one-time order spikes, outages, or promotional surges. Removing or flagging these outliers can improve your ability to identify patterns by 30–60%.
Next, ensure consistency in how you define and process your data. For example, returns, discounts, and product categories should be handled the same way across all time periods. If you operate in multiple regions or time zones, standardize timestamps to a single time zone to avoid overlaps. Also, account for calendar variations – months differ in length, and holidays like Thanksgiving fall on different dates each year. Adjusting for these factors can improve pattern detection by 20–40%.
"For reliable forecasting, you need data for at least 2–3 complete cycles, otherwise you’ll mistake a random spike for a sustainable pattern." – Kate Chabanova, S-Rocket
Tools for Organizing Your Data
A well-organized spreadsheet is a great place to start. Export 24–36 months of sales data and structure it in layers:
- Raw data tabs: Keep the original data untouched.
- Reference tabs: Include SKU mappings and product identifiers.
- Calculation tabs: Clean, merge, and process your data here.
- Analysis tabs: Use these for final insights and decision-making.
Avoid placing formulas directly in raw data tabs – it’s a quick way to accidentally break your entire workbook.
At a minimum, your dataset should include columns for date, order ID, SKU, product category, units sold, revenue, ad spend, and sales channel. If your data becomes too large or you’re managing multiple marketplaces, consider tools like Power BI or Looker Studio. These platforms can handle larger datasets and provide more advanced visualizations than spreadsheets.
Once your data is clean and organized, you’ll be ready to move on to defining seasonal patterns and segments in the next step.
Step 2: Define Seasonal Periods and Key Segments
Once your data is organized, the next step is to pinpoint the seasonal periods that influence your business and segment the data to uncover recurring trends.
How to Identify Your Seasonal Periods
Not all businesses operate on the same seasonal timeline. Seasonality can arise from various factors, including holidays, weather shifts, planned events, or even income cycles. Your goal is to determine which of these factors impacts your business the most.
Start by analyzing historical data to spot consistent shifts in demand. For instance, certain months may show noticeable spikes in orders, while others experience significant dips. September, for example, has become a strong month for many businesses due to fall transitions and back-to-school activities.
"Seasonal demand isn’t defined by holidays or weather alone. It’s defined by repeatable demand shifts that materially change replenishment decisions." – Sumtracker
It’s also important to distinguish between organic customer demand and demand spikes caused by promotions. For example, if a sales surge in March aligns with a discount campaign, it’s more likely driven by your marketing efforts rather than a natural seasonal trend.
Once you’ve identified the key periods, dive deeper into your data by creating meaningful segments.
Segmenting Data for Deeper Analysis
Averages across broad categories can often hide important details. While an entire product line may appear steady, individual SKUs or variants can show significant fluctuations. To uncover these nuances, consider segmenting your data by factors such as:
- Sales channels: For instance, marketplaces might see holiday-related demand earlier than direct-to-consumer websites.
- Geography: Regional differences can be striking – an air conditioner might see a 13% increase in demand in one city while dropping by 17% in another due to localized weather patterns.
- Customer type: Separating new and returning customers can provide valuable insights, as these groups often follow different seasonal demand cycles. Mixing their data could lead to inaccurate conclusions.
Using Time Series Visualization
Once your data is segmented, visualizing it can help you uncover actionable trends. A simple line chart works well, with dates on the horizontal axis and sales volume on the vertical. Overlay data from two to three years to confirm the recurrence of patterns. Adjust the time scale depending on your focus – monthly views are ideal for spotting broad seasonal shifts, while daily or weekly views can highlight more specific trends, like spikes on certain days of the week (e.g., higher sales on Fridays).
A good time series chart will highlight long-term trends, seasonal patterns, and residual noise. This clarity helps you separate temporary surges from consistent growth opportunities.
Step 3: Measure Trends with Seasonality Indices and Analytics Tools
Now that you’ve segmented your data, it’s time to dive deeper into the numbers. This step is all about quantifying those seasonal ups and downs. While visualizations can show you when peaks and valleys occur, seasonality indices help you understand how much those fluctuations matter.
How to Calculate Seasonality Indices
A seasonality index gives you a way to measure a specific period’s performance relative to the overall average. The formula is:
Seasonality Index = (Average Sales for Period ÷ Overall Average Sales) × 100
Here’s how to interpret it:
- An index of 1.0 (or 100) means the period performs at the average.
- An index of 1.5 indicates 50% better performance than average.
- An index of 0.7 means performance is 30% below average.
For businesses experiencing steady growth, the moving average method is often more accurate than simple averages. This approach uses a 12-month centered moving average (CMA) to filter out growth trends and isolate the actual seasonal patterns. Divide actual sales by the CMA to calculate the seasonal ratio. Keep in mind that this method works best with 24–36 months of data to ensure reliability. Once you’ve calculated the indices, normalize them so they add up to 12 (for monthly data).
With these indices, you can go further by applying advanced analytical techniques to sharpen your insights.
Analytics Methods to Use
After calculating indices, two key methods can help you refine your understanding of seasonal trends:
- Moving Averages: These smooth out short-term fluctuations, making the overall trend easier to spot.
- Time Series Decomposition: This method breaks your data into three components: trend, seasonality, and residual noise.
If your seasonal fluctuations stay consistent, use the additive model. If the peaks and troughs grow along with your business, the multiplicative model is a better fit – this is especially useful for ecommerce brands experiencing growth.
"Time series decomposition is a statistical technique that breaks the time series into several separate features like trend, seasonality and residuals. This step is useful for eliciting the patterns and behaviors present in the data." – Om Rathod, Co-founder & CRO, Trivas
For teams wanting to streamline this process, AI-powered tools like Amazon Forecast can incorporate external factors (e.g., weather, holidays, promotions) and boost forecasting accuracy by up to 50% compared to non-AI tools. Platforms like iDerive can also integrate data from Amazon, Walmart, and Target to uncover seasonal trends at the SKU level.
Visualizing Seasonal Data
Once you’ve done the math, visualizing the data makes it easier to spot patterns and act on them. Year-over-year (YoY) comparison charts are especially effective – they let you compare metrics like revenue, units sold, or conversion rates across multiple years on a single chart. This helps separate recurring seasonal trends from one-off anomalies.
For a more detailed view, try a Month × Day-of-Week heatmap. This can reveal nuanced patterns that might be missed in a basic line chart, like weak performance on specific weekdays in October or unusually high conversions on Fridays in November. If you’re looking for outliers, a residual scatter plot can highlight anomalies worth investigating.
You should also track conversion rates by period, as traffic and purchases don’t always align. For instance, data from over 14,000 merchants shows that November typically sees 64% more orders than the annual average, while February experiences a 32% drop. That’s a 96-percentage-point swing – information that becomes actionable when paired with seasonality indices.
Step 4: Assess Seasonal Sales Mix and Profitability
Once you’ve calculated your seasonality indices, it’s time to figure out which seasons are driving your revenue and profit.
How to Calculate Sales Mix by Season
The sales mix shows what percentage of your yearly revenue comes from each season. To figure it out, divide each season’s total revenue by your annual revenue, then multiply by 100. For many retailers, the period from Black Friday through late December can account for 25% to 40% of total yearly revenue. With such a heavy reliance on Q4, a disappointing performance during this period can significantly impact the entire year.
But don’t just stop at broad categories. Dive deeper into SKU-level trends to identify which specific products consistently contribute to seasonal revenue and which don’t perform as well during peak times. It’s also essential to separate organic demand from promotion-driven spikes. This distinction, as discussed earlier, is vital to avoid skewed forecasts and provides a clearer picture of your revenue mix.
Once you’ve analyzed revenue contributions, the next step is determining how they translate into profitability.
Measuring Profitability and ROI by Season
High-revenue seasons aren’t always the most profitable. Factors like discounts, overtime labor, expedited shipping, and increased warehouse costs can eat into margins, even when revenue looks strong. For instance, offering a 30% discount on a product with a 50% gross margin means you’ll need to sell 2.5 times as much to break even. This is why it’s critical to calculate profitability before launching any seasonal promotion.
This kind of analysis ties directly back to the structured historical data you organized in Step 1. Each layer of data builds toward more accurate and actionable seasonal forecasting.
"We hit our revenue target during the holiday season, but our margins were worse than last year. Are our promotions actually working, or are we just buying revenue?" – KISSmetrics Editorial
Here’s a breakdown of the key metrics to track for each season:
| Metric | What It Tells You |
|---|---|
| Gross Margin (Pre vs. Post Promotion) | Whether seasonal revenue gains are offset by discounts |
| Incremental Revenue | How much extra revenue a promotion generates above the baseline |
| Promotional Sales Share | The proportion of seasonal sales driven by discounts versus organic demand |
| Average Basket Value | Whether customers are spending more per transaction during the season |
| Stock Turnover | How quickly inventory moves during peak versus slower periods |
Tracking these metrics alongside operational KPIs like inventory turnover gives you a complete picture of seasonal performance.
How Seasonality Affects Operations
Revenue isn’t the only factor influenced by seasonality – operations play a big role, too. For example, ecommerce brands can lose 25–30% of potential revenue from stockouts during peak seasons. On the other hand, carrying costs for seasonal inventory, including warehousing, insurance, and depreciation, often add up to 20–30% of total inventory value.
There’s also something called the shortage vicious circle. When a product runs out during a peak season, your sales data reflects a drop – not because demand decreased, but because you didn’t have enough stock. If your forecasting model uses that suppressed data, it could recommend ordering less the next year, worsening the problem. Correcting historical data for stockouts can reduce forecasting errors by 19%.
To avoid this trap, monitor units sold per day during peak periods instead of just looking at total stock levels. This approach helps you spot when sales velocity is picking up faster than anticipated, giving you time to react before inventory runs out.
Step 5: Turn Seasonal Insights into Ecommerce Action Plans
The data you’ve gathered in earlier steps only becomes meaningful when it informs decisions. Using your organized data, defined seasonal periods, and calculated indices, it’s time to develop actionable ecommerce strategies. This step focuses on transforming your seasonality indices, profitability metrics, and operational insights into a practical and executable plan.
Building a Seasonal Sales Forecast
To start, apply your seasonality indices to a baseline sales figure. Multiply your expected average monthly revenue by each month’s index to project seasonal performance. Make sure your historical data is clean before applying these indices – correct for periods where stockouts may have skewed sales data.
Not every SKU demands the same level of forecasting effort. Prioritize Class A items, which typically represent about 20% of your SKUs but generate 80% of your seasonal revenue. For lower-volume items, simpler forecasting methods or even dropshipping can help avoid tying up capital in slow-moving stock.
"Your seasonal forecast is only as good as your pipeline data… The shortage vicious circle is the most insidious failure mode." – Prospeo Team
Choosing the right forecasting method is crucial. Holt-Winters is effective if you have at least two years of clean, stable seasonal data. For modeling specific holidays or events, Prophet offers an approachable solution for leadership presentations. For teams managing large, complex catalogs, machine learning models like LightGBM can deliver higher accuracy but may require more technical expertise. Once you have your projections, align your marketing efforts to match anticipated demand shifts.
Adjusting Marketing and PPC Campaigns by Season
With a clear forecast in hand, fine-tune your marketing and PPC strategies. One often overlooked opportunity lies in the shoulder season – the quieter period between peak windows. During summer months, for example, customer acquisition costs are typically 20% lower than during the holiday rush. Use this time to focus on acquiring customers with higher lifetime value.
For peak periods, launch your PPC campaigns at least two months ahead of time. This early start gives your ads time to gain performance data, improve rankings, and build social proof before competition heats up. As the peak approaches, shift your messaging to emphasize urgency. Email subject lines highlighting shipping cut-off dates, for instance, perform 40% to 60% better than generic holiday messaging.
A smart move is to sync your PPC campaigns with inventory levels. If a product hits its safety stock threshold, automatically pause or redirect ad spend away from that listing. Driving traffic to an out-of-stock product not only wastes money but also hurts conversion rates.
Aligning Inventory and Merchandising with Seasonal Demand
Using your seasonal sales mix and profitability analysis, align your inventory and merchandising strategies with forecasted demand. Start inventory planning 8 to 12 weeks before your peak season. This gives you time to review slow-moving items, finalize SKU-level forecasts, and confirm order quantities with both primary and backup suppliers. When calculating safety stock, use the standard deviation of demand during the peak period rather than the annual average, as traditional formulas often underestimate peak-season risks.
During the season, focus on tracking units sold per day instead of total stock on hand. This velocity metric helps you identify when demand is accelerating unexpectedly, allowing you to reorder before running out. After the season ends, conduct a detailed post-season review. Compare forecasted demand with actual sales, note any lead-time variances, and identify which SKUs over- or underperformed. These insights will improve your accuracy for the next year.
"Seasonal planning is not just about knowing when Black Friday falls. It is about understanding the full annual rhythm of consumer behavior and aligning your inventory, promotions, content, and marketing spend to match." – Todd McCormick, Chartimatic
For brands operating across multiple channels – whether on Amazon, Walmart, TikTok Shops, or their own ecommerce site – coordinating inventory, PPC, and merchandising can quickly get complicated. Emplicit offers full-spectrum ecommerce services, including PPC management, inventory planning, and listing optimization, to help brands execute cross-channel seasonal strategies smoothly.
Conclusion: Using Seasonal Trends to Support Long-Term Growth
Seasonal analysis isn’t something you do once and forget about – it’s an ongoing process. The five steps we’ve covered create a cycle that helps fine-tune your forecasts year after year. Each step gives you the tools to adjust, improve, and grow, while the data you collect each season sharpens your future strategies.
What sets successful brands apart isn’t how much they spend – it’s how much they learn. As Ezra Firestone, Co-founder of BOOM! by Cindy Joseph and Zipify, says:
"Every seasonal campaign is a data asset. The stores that document their results obsessively – what creative worked, what email timing worked, what offer resonated – have an enormous advantage."
These lessons translate into smarter budget decisions. Instead of spreading your budget evenly throughout the year, focus your spending on periods of peak performance. Treating your budget as a flat, year-round expense is, as some experts call it, "strategic malpractice".
Don’t overlook the quieter months either – they’re prime opportunities for preparation. For example, Q1 and April are great times to launch retention efforts, refine your product line, or test your backend systems to ensure they can handle a surge in demand during the next peak season. By using these slower periods wisely, you’re setting yourself up for consistent growth, not just seasonal wins.
If managing all this feels overwhelming, consider partnering with experts who can simplify the process. For brands juggling multiple sales channels – be it Amazon, Walmart, TikTok Shops, or their own ecommerce site – Emplicit offers a range of services like PPC management, inventory planning, listing optimization, and brand management. Instead of piecing together data from different platforms, Emplicit consolidates it all, giving you a clear, actionable view to base your seasonal strategies on real numbers, not guesswork.
FAQs
How do I separate true seasonality from promo-driven spikes?
To distinguish genuine seasonality from spikes driven by promotions, start by breaking down sales data into four key components: trend, seasonality, holidays, and noise. Work with 2–3 years of clean data to uncover consistent patterns. Normalize for promotions by separating out their impact, ensuring they don’t skew the results. For periods with stockouts, estimate demand to fill the gaps. Then, calculate seasonal indices by dividing the demand for each period by the overall average demand. This approach allows you to measure seasonality accurately and pinpoint deviations caused by promotions or other external influences.
What if stockouts distorted my historical sales data?
If stockouts have skewed your sales data, it’s crucial to adjust it to reflect unconstrained demand. Relying on raw sales figures during stockouts can throw off your forecasting models, leading to repeated under-ordering and missed opportunities.
To fix this, estimate what the true demand would have been during the stockout period. For instance, if your product was unavailable for 10 out of 30 days in a month, adjust your sales data to account for the demand you missed during those 10 days. This way, your forecasts will better represent the actual market demand rather than the gaps caused by stockouts.
How do I use seasonality indices to forecast by SKU?
To forecast with seasonality indices, start by calculating a seasonal index for each time period. This involves dividing the SKU’s average demand for a specific period by its overall average demand. For instance, if an SKU averages 100 units monthly but sells 150 units in December, the seasonal index for December would be 1.5.
Once you have the index, apply it to your base demand. For example, if you’re forecasting December sales, take the prior year’s sales, adjust them by the expected growth rate (e.g., multiply by 1.1 for 10% growth), and then multiply by the seasonal index of 1.5. This gives you a seasonally adjusted forecast tailored to expected demand patterns.