
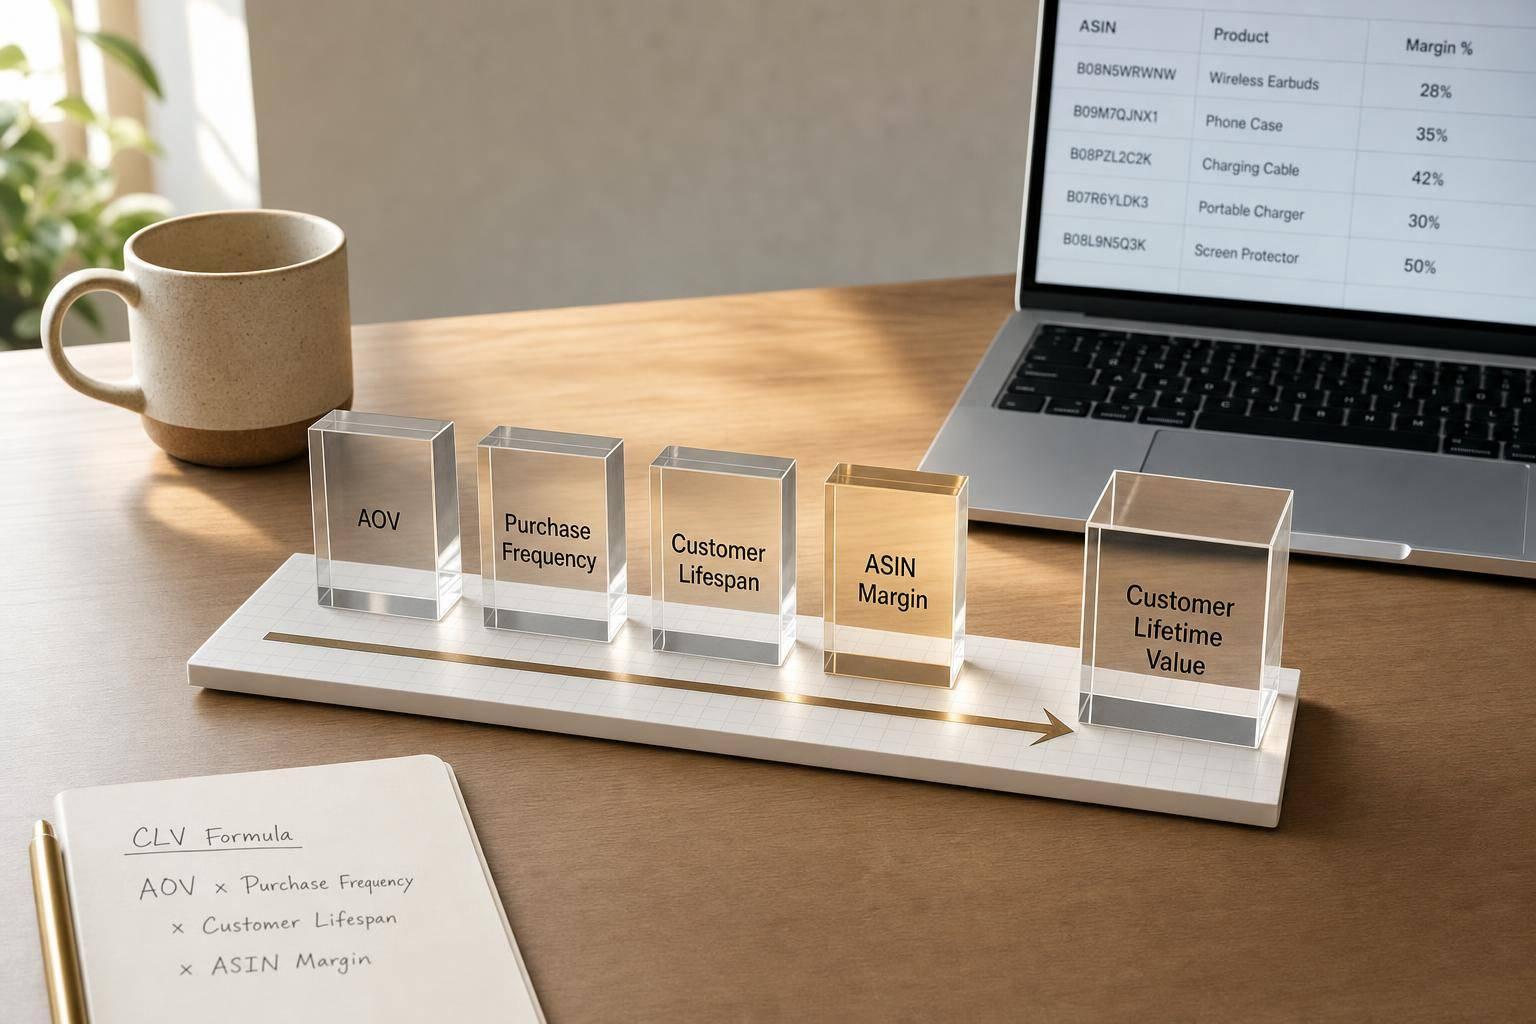
If I want a CLV number I can use on Amazon, I should not stop at revenue. I need to look at profit per customer, using AOV, purchase frequency, customer lifespan, repeat purchase behavior, and margin by ASIN or cohort.
Here’s the short version:
- Basic CLV = AOV × Purchase Frequency × Lifespan
- Margin-based CLV = (AOV × Margin %) × Purchase Frequency × Lifespan
- A customer with $250 in revenue at 40% margin is worth $100 in gross profit
- A customer with $300 in revenue at 20% margin is worth only $60
- So on Amazon, higher revenue does not always mean higher customer value
What I’d focus on first:
- Pull 12 to 24 months of Seller Central and Brand Analytics data
- Separate one-time buyers, Subscribe & Save customers, and brand referral cohorts
- Calculate CLV by ASIN or customer segment, not just storewide
- Use CLV to set CAC limits, ad budgets, and SKU priorities
A simple way to think about it: if I only watch ROAS, I may put money behind products that look good on the first order but lose steam after fees, discounts, and weak repeat buying. If I use margin-based CLV, I get a much better read on what each customer is worth over time.
Quick comparison:
| Model | What it measures | Best use |
|---|---|---|
| Basic CLV | Lifetime revenue per customer | Fast benchmark |
| Margin-based CLV | Lifetime profit per customer | Budget and bidding decisions |
| ASIN-level CLV | Value by product | SKU spend priority |
| Cohort CLV | Value by customer group | Compare S&S, referral, and one-time buyers |
So if I’m trying to answer how much I can spend to get a customer or which ASIN deserves more budget, this is the right framework to use.
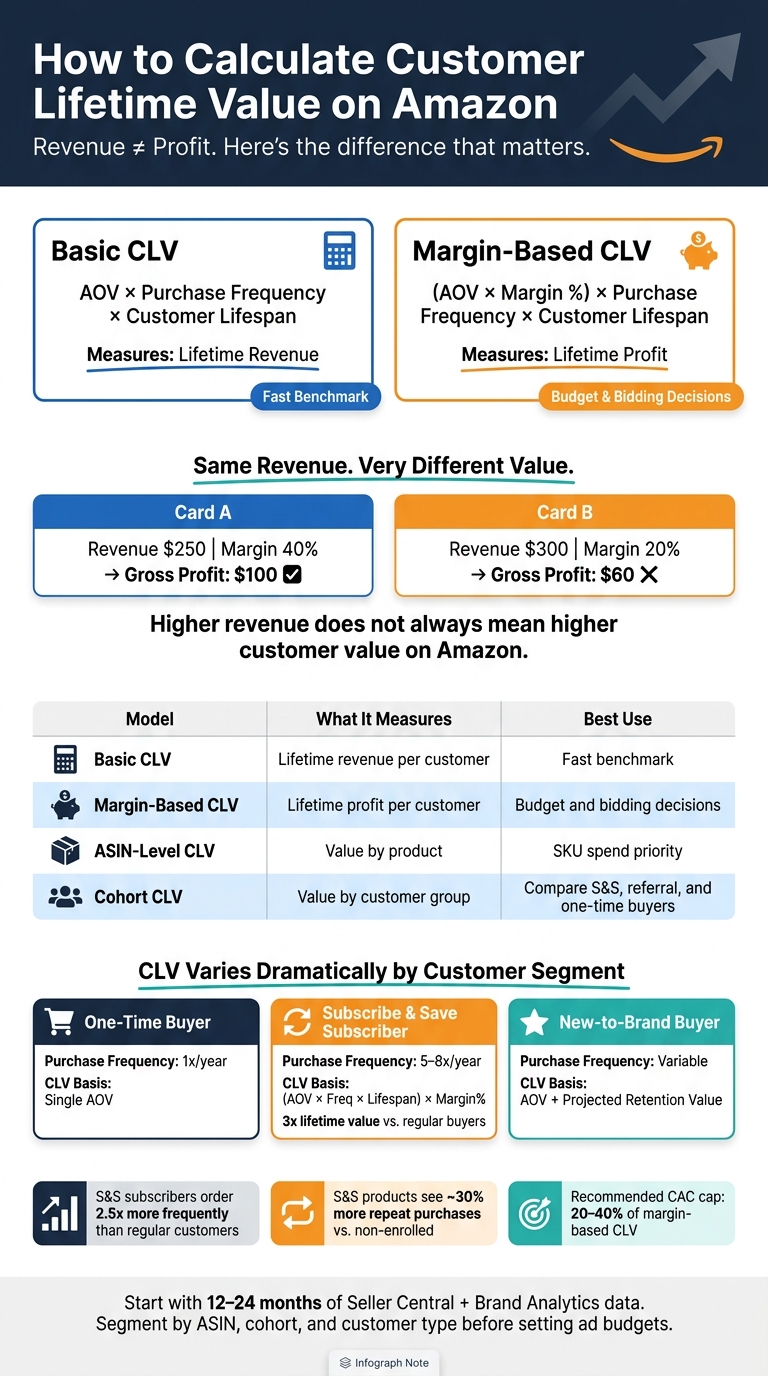
Amazon CLV Models Compared: Revenue vs. Margin-Based Customer Value
How to calculate LTV for Amazon: A must-have guide for CPG brands
sbb-itb-e2944f4
Step 1: Gather the Amazon data you need
Before you calculate CLV, start with clean exports from Seller Central. Each report should map to one input: AOV, repeat rate, lifespan, or margin. That’s the key idea here. If your reporting periods don’t line up, your CLV math won’t line up either.
Pull order, customer, and repeat purchase data
Start in Business Reports inside Seller Central. Reports like By Date – Sales and Traffic and By ASIN – Detail Page Sales and Traffic give you sales, units, and order count by ASIN. You’ll use those numbers for AOV and purchase frequency.
Pull at least 12 to 24 months of data. A short window can throw things off, especially if it includes a holiday bump or some other seasonal surge.
Then pull the Repeat Purchase Behavior report from Brand Analytics. This report shows:
- orders
- unique customers
- repeat customers
- repeat purchase sales
- repeat purchase units
- share of sales from repeat buyers
You can view this at both the brand level and the ASIN level. The ASIN view matters because it helps you spot which products lead to repeat purchases and which ones are mostly one-and-done buys.
Your dataset should include total sales, order count, unique customer count, repeat customer count, date range, repeat purchase sales, repeat purchase units, and revenue by ASIN. Add source or cohort labels for Subscribe & Save and referral traffic so those groups stay easy to track later.
Add Subscribe & Save and referral-acquired customer data
Subscribe & Save customers don’t behave like one-time buyers, so don’t lump them together. Model them as their own group.
Use the Subscribe & Save dashboard to track subscription orders, sales, and units for a selected date range. From there, estimate how long the average subscriber stays active and how often they reorder. Since subscription pricing is lower, adjust revenue per order to reflect that lower price.
For acquisition cohorts, use the Brand Referral Bonus report in Seller Central to identify referral-acquired customers. That makes it easier to compare them with other customer groups over time instead of mixing everything into one blended view.
Build a worksheet for calculation
Set up your spreadsheet with four tabs:
- overall Amazon data
- ASIN-level margin
- Subscribe & Save customers
- referral cohorts
The main tab should hold your top-line numbers: total sales, orders, unique customers, and repeat rate.
The ASIN tab is where you’ll later add revenue, cost of goods, Amazon fees, and gross margin by product. You’ll need that for the margin-based CLV step.
The cohort tabs keep subscription and referral data separate, which helps you avoid muddy blended averages.
Before you move on, do a quick data check. Make sure:
- date ranges match across exports
- subscription orders are separated from one-time purchases
- returns and cancellations are handled the same way across reports
- counts and currency formatting match across exports
If those pieces don’t line up, repeat rate and lifespan can drift fast.
With clean data in place, you’re ready to calculate AOV, purchase frequency, repeat rate, and lifespan in the next step. Once the exports are aligned, Step 2 turns them into AOV, frequency, repeat rate, and lifespan.
Step 2: Calculate the core CLV inputs
Use your main Amazon tab and cohort tabs to work out the four inputs behind CLV: AOV, purchase frequency, repeat purchase rate, and lifespan.
Calculate AOV, purchase frequency, and repeat purchase rate
AOV is simple. Divide total revenue by total orders. If your Amazon business brought in $350,000 from 10,000 orders over 12 months, your AOV is $35.00.
Purchase frequency shows how often the average customer ordered during that same period. Divide total orders by total unique customers. Using the same example, if those 10,000 orders came from 4,000 buyers, purchase frequency is 2.5 orders per customer per year.
Repeat purchase rate is a different signal. It shows how many customers came back and bought again, while purchase frequency shows total order activity. If 1,600 of those 4,000 customers placed at least two orders, your repeat purchase rate is 40%. In plain English: purchase frequency feeds the CLV formula, and repeat purchase rate helps you judge retention and compare one cohort against another.
Estimate customer lifespan from historical buying behavior
Amazon doesn’t give you full customer-level purchase history, so the best move is to lean on cohorts. Group customers by first purchase month or quarter. Then track how many orders each cohort places over the next 12 to 24 months. Use that same setup for referral-acquired customers so you can compare them with organic and ad-driven buyers.
If order activity drops close to zero by month 24, a 2-year lifespan is a fair assumption. As a starting range, use 1 to 3 years.
Subscribe & Save data gives you another way to check that estimate. Amazon’s Subscribe & Save dashboard and Reorder sales metrics show repeat purchasing over the past 12 months. If subscribers average 6 shipments over 9 months before canceling, that points to a 0.75-year subscription lifespan. Not all Amazon cohorts behave the same way, so it’s better to model Subscribe & Save and referral-acquired customers on their own instead of mixing them into one overall lifespan figure.
It also helps to compare repeat purchase rate with purchase frequency. Say you have a 55% repeat purchase rate but only 1.8 orders per year in purchase frequency. That usually means many customers come back once, then disappear. That’s a sign of a shorter lifespan. On the flip side, a lower repeat rate with higher order frequency among returners can point to a smaller but more loyal group that deserves a longer time horizon in your model.
Build a basic CLV number first
Once you have AOV, purchase frequency, and lifespan, the formula is simple:
CLV = AOV × Purchase Frequency × Customer Lifespan
Using the numbers above – $35.00 AOV, 2.5 purchase frequency, and a 2-year lifespan – your basic CLV comes out to $175.00 in expected lifetime revenue per customer.
That first number is a directional revenue estimate, not a profit figure. It doesn’t include margin, fees, returns, or acquisition cost. Use it as your baseline when comparing cohorts before you adjust for margin in the next step.
Step 3: Adjust CLV for margin, ASIN, and customer segment
The baseline CLV from Step 2 gives you a revenue figure, not a profit figure. That matters more than it may seem.
Two ASINs can post the same CLV in a spreadsheet and still produce very different returns once you account for fees, fulfillment, and discounts. So start with the Step 2 revenue CLV, then adjust it based on margin and customer type.
Calculate margin-based CLV by ASIN
For each ASIN, calculate margin-based CLV using the same customer lifespan from Step 2. The key input here is contribution margin.
To get contribution margin, subtract variable costs from revenue, including:
- Amazon referral fees
- FBA fulfillment fees
- Product cost
- Promotional discounts
What’s left is your contribution margin.
The formula becomes:
Margin-Based CLV = (AOV × Purchase Frequency × Customer Lifespan) × Contribution Margin %
Run this for each ASIN, and the picture gets a lot clearer. Some products look strong on a revenue basis but weaken once costs show up. Others hold up well and are far more worth paying to acquire customers for.
Separate Subscribe & Save and brand referral customers into cohorts
Before you compare CLV across customers, split Subscribe & Save and brand referral traffic into their own cohorts.
Subscribe & Save customers should sit apart from one-time buyers because their behavior is different. They often generate 5 to 8 additional orders over 12 months at low acquisition cost. Their per-order margin also changes because of the subscriber discount, so combining them with regular buyers can skew the model.
Brand referral traffic also deserves its own cohort when it brings in strong new-to-brand rates. High new-to-brand rates matter because they build future repeat purchases and cut long-term ad dependency.
Build a segment comparison table for decision-making
Once you’ve split margin by ASIN and cohort, compare the segments side by side. This helps you see where budget should go and where your current model may be giving too much credit.
| Customer Segment | Typical Purchase Frequency (12 Mo.) | CLV basis |
|---|---|---|
| One-Time Buyer | 1 | Single Order Revenue (AOV) |
| S&S Subscriber | 5–8 | (AOV × Frequency × Lifespan) × Margin % |
| New-to-brand buyer | Variable | Initial AOV + Projected Retention Value |
This table makes the point pretty plain: not every segment should be valued the same way. Subscriber-intent customers tend to carry more long-term value, which shifts how each cohort should be weighted in your model.
Step 4: Use CLV to guide budget and channel decisions
Once you have CLV by segment, you can make smarter budget calls than you would with first-order ROAS or ACoS alone. The point is simple: tie what a customer is worth over time to what you can afford to spend to win that customer.
Set ad spend targets based on expected customer value
One of the clearest uses of margin-based CLV is setting a maximum customer acquisition cost (CAC) for each segment. A common starting range is to cap CAC at 20–40% of margin-based CLV, based on your cash flow and appetite for risk. So if your Subscribe & Save cohort has a margin-based CLV of $150 and your standard marketplace buyers average $60, a sensible CAC ceiling could be $45 for subscription-focused campaigns and $18 for general acquisition campaigns.
Amazon Ads recommends calculating customer lifetime value before setting a profitable ad budget. In practice, that means mapping CLV by segment to your main acquisition channels:
- Sponsored Products
- Sponsored Brands
- Sponsored Display
- External traffic such as Meta or Google
From there, set target CAC, TACoS, and ROAS thresholds for each cohort. If CAC sits well below a cohort’s CLV, that campaign may deserve more budget. If CAC is getting close to CLV, tighten the campaign first. And if it still costs more than the segment can support, it’s time to cut it back or give it a new job.
For subscription cohorts, Amazon’s Subscribe & Save dashboard can help you compare subscriber lifetime value by customer segment and average reorders per subscriber vs. non-subscriber. That gives you a clearer read on whether a campaign is bringing in durable customers or just bargain hunters who disappear after the first deal.
Prioritize ASINs and retention programs with stronger long-term returns
CLV by ASIN helps you decide which SKUs should get more ad budget, listing work, and promo support. A replenishable product with a lower AOV but a margin-based CLV of $200 from frequent reorders may deserve more attention than a one-time purchase item with an $80 AOV and little repeat behavior.
For Subscribe & Save-eligible products, the case gets even stronger. Subscribers place orders 2.5x more frequently and carry about 3x the lifetime value of regular customers. Products enrolled in Subscribe & Save also see about 30% more repeat purchases than non-enrolled products.
That kind of lift can support more aggressive introductory offers, ad copy built around subscription sign-ups, and stronger investment in listing quality, such as:
- Enhanced images
- A+ content
- Detailed usage information that can cut returns and help keep customers subscribed longer
The same idea applies to external traffic. If brand referral cohorts show stronger CLV than organic marketplace buyers, you have a clear reason to accept a higher CAC on Google or Meta campaigns, as long as it still fits your CLV-based threshold and payback window.
When to get outside help for CLV reporting
A CLV model gets messy fast when you’re juggling dozens of ASINs, multiple traffic sources, and subscription data on top of standard ad reporting. If your team can’t reliably connect Amazon Business Reports, Brand Analytics, ad console data, and ASIN-level margin in one view, the model starts to fall apart. And when that happens, the calls built on it fall apart too.
That’s usually the point where outside help starts to make sense. Emplicit works with brands on this kind of connected reporting and execution: marketplace management, PPC strategy tied to margin-based CLV, listing optimization, inventory planning for high-CLV products, and custom ecommerce strategy across Amazon, TikTok Shops, Walmart, Target, and brand-owned sites. A team that can keep cohort segmentation accurate – Subscribe & Save vs. external traffic vs. one-time buyers – and keep CLV calculations up to date can turn the model from a spreadsheet exercise into a tool you can actually use.
Conclusion: A practical CLV model for Amazon sellers
A practical CLV model starts with repeat purchase data. From there, you turn AOV, purchase frequency, lifespan, and margin into a profit-based number. That gives you something far more useful than top-line revenue: a clearer view of what a customer is worth to your business.
Once the math is in place, the next step is simple. Use it to make spending and product decisions.
Segmentation matters because CLV shifts by ASIN, margin, and cohort. Repeat purchase rate, Subscribe & Save data, brand referral traffic, and margin by ASIN or segment help you spot the difference between strong cohorts and weak ones. If you treat every customer group the same, you leave profit on the table.
A working CLV model should help you:
- Set ad limits
- Prioritize high-value ASINs
- Separate strong cohorts from low-value ones
Keep the model simple. Update it often. Then review it by ASIN and cohort before making budget calls.
FAQs
What’s a good CLV-to-CAC ratio on Amazon?
A common rule of thumb on Amazon is a 3:1 CLV-to-CAC ratio. Put simply, for every $1.00 you spend to get a customer, you should aim to earn $3.00 in lifetime value.
That kind of margin gives you more breathing room when you invest in growth. For example, you can go after more competitive keyword bids, knowing that repeat purchases down the line may help offset the upfront cost of getting that first sale.
How often should I update my Amazon CLV model?
Update your Amazon CLV model at least quarterly so it stays in step with how customers shop and buy.
If you use AI-powered systems, you can update the model in real time and get a more current view of what’s happening. Real-time metric tracking, along with automated daily or weekly reports, can help you spot high-value segments and react when conversion rates or customer behavior start to shift.
Should I exclude returns and discounts from CLV?
No. To calculate Customer Lifetime Value with accuracy, include returns and discounts because they directly affect revenue and profit margins.
When you factor them in, you get a clearer picture of actual profitability. That makes it easier to spot high-value customer segments and make better budget decisions for retention.