
Data silos are a major problem for ecommerce businesses, causing inefficiencies, inaccurate insights, and revenue loss. When platforms like Amazon, Shopify, and Facebook Ads store data separately, businesses struggle to track performance, allocate budgets effectively, and make informed decisions. This case study explores how one company, managing five brands, tackled these challenges by implementing a unified data system.
Key Takeaways:
- The Problem: Disconnected data across sales, ads, and inventory led to poor attribution and wasted resources. Only 60–70% of sales were accurately tracked, and ad spend was wasted on out-of-stock products.
- The Solution: A centralized data warehouse with automated ELT pipelines streamlined data integration. Platforms like Shopify, Google Ads, and Amazon were connected, enabling accurate, cross-channel attribution and real-time insights.
- The Results: Attribution accuracy improved by 40%, manual reporting time dropped by 80%, and over $5,000/month in ad spend was saved. Decision-making sped up, and operational inefficiencies were resolved.
Breaking down silos isn’t just about better insights – it’s about recovering lost revenue, improving efficiency, and empowering teams with reliable data.
Breaking Down Data Silos and How to Unlock Business Insights with Connected Data
sbb-itb-e2944f4
The Problem: Disconnected Traffic Data Across Multiple Marketplaces
The client in this case study – a multi-brand appliance company managing five distinct brands – faced a major challenge: their paid media campaigns ran across platforms like Amazon, their own DTC websites, Meta, and Google Ads, but none of these systems communicated with each other. This lack of integration left traffic data isolated in separate silos, creating a fragmented view of performance.
Before Q4 2022, the company could only track about 60–70% of sales. Analytics across platforms like GA4, Meta, Google Ads, and Amazon were inconsistent, leading to a ROAS as low as 0.02x. Marketing managers spent hours manually consolidating data, which left them without a clear picture of which channels were driving results. Instead of focusing on growth, they were stuck cleaning up data. Leadership was left in the dark, unable to answer critical questions like, “Which channel is performing best?” or “Should we allocate more budget to Amazon ads?”
"Meetings were spent fixing data instead of finding opportunities to scale."
How Data Silos Hurt Business Performance
The lack of connected data didn’t just create confusion – it directly impacted the company’s bottom line. With fragmented information, blind spots emerged, leading to frequent poor decisions. For example, the company couldn’t identify how activity on one platform influenced another. A customer might see a Facebook ad, explore the product on the company’s website, but ultimately make the purchase on Amazon. Without unified data, that Facebook ad would appear ineffective.
Operational inefficiencies made things worse. Marketing campaigns continued running even when inventory was low because media data wasn’t synced with inventory systems. On top of that, relying on last-touch attribution undervalued early-stage efforts like brand awareness and social media engagement. These gaps in data management were estimated to drain 5–10% of the company’s potential revenue.
Step 1: Auditing and Mapping the Data Ecosystem
The first step was to audit the entire data ecosystem. This began with a detailed inventory of every system interacting with customer data. These included advertising platforms like Meta and Google Ads, sales channels like Amazon and Walmart, and the company’s own direct-to-consumer (DTC) websites. The team meticulously documented where the data resided, who managed it, and how it was accessed – whether through APIs or manual exports.
To identify discrepancies, they compared transaction data side-by-side in a consolidated spreadsheet. For example, they flagged revenue differences between GA4 and the backend system. To go further, they exported raw transaction-ID level data from all platforms and used functions to highlight orders missing from analytics tools.
The audit went beyond numbers, diving into tracking protocols to pinpoint attribution issues. They reviewed naming conventions and UTM parameters, discovering inconsistencies that disrupted attribution and increased the need for manual reconciliation.
What the Audit Revealed
This deep dive into the data ecosystem exposed not just numerical gaps but also operational inefficiencies. It confirmed earlier concerns: only 60%–70% of sales were being accurately tracked across the company’s five brands. Revenue data from platforms like GA4, Meta, and Google Ads didn’t align with backend systems, with discrepancies reaching 30–40%. Adding to the challenge, the brands operated on different ecommerce platforms – BigCommerce and ModX – which created technical hurdles for unified reporting.
"The issue wasn’t effort, it was a lack of visibility, consistency, and confidence in analytics." – PenPath
The audit also highlighted specific technical flaws: cookie consent configurations were broken, leading to significant data loss; UTM parameters varied widely across campaigns; and inventory systems weren’t linked to marketing platforms. Marketing managers were spending 10–15 hours every week reconciling conflicting reports. Without a unified source of truth, stakeholder meetings often devolved into debates over which numbers were accurate instead of focusing on growth strategies. These findings laid the groundwork for creating a unified data system to break down silos and streamline operations.
Emplicit‘s Solution: Building a Unified Data System

Emplicit tackled the issue of fragmented data head-on by designing a solution that automated and centralized data processes. After identifying revenue discrepancies and data silos during their audit, they replaced outdated spreadsheets and manual exports with a cutting-edge data infrastructure. This new system was built to handle input from multiple sales channels and marketplaces seamlessly.
The core of their approach revolved around automated ELT pipelines and a central data warehouse, creating a single source of truth. This setup restructured data flows, paving the way for smoother and continuous data integration.
Setting Up Automated Data Pipelines
Instead of using traditional ETL (Extract, Transform, Load) processes, Emplicit implemented ELT (Extract, Load, Transform) pipelines. This modern approach allowed raw data to be loaded into the warehouse first and transformed later – an essential step when working with the semi-structured JSON data that ecommerce APIs typically provide.
To ensure smooth data extraction, the team developed custom connectors tailored to each platform’s API. For Shopify, they opted for the GraphQL API over REST. Why? The GraphQL API operates on a cost-point system (1,000 points per minute), offering more flexibility compared to REST, which restricts requests to just 40 per app, per store, per minute. They also focused on high-value endpoints, such as the Orders API, which consolidates customer, discount, and refund data into a single call. This reduced the need for multiple requests.
The pipelines were carefully designed to respect rate limits while maximizing efficiency. Data syncing occurred automatically every 6 hours, eliminating the need for manual updates.
One of the technical hurdles was converting nested JSON into relational tables suitable for business intelligence. To address this, the team built custom "denesters" for each API, ensuring raw data could be transformed into actionable insights. Automated quality checks were also introduced to flag issues like missing values or duplicates before the data reached the reporting layer.
Creating a Central Data Warehouse
Once the pipelines were in place, the next step was to centralize all the data for unified analysis. Google BigQuery was chosen as the foundation for the warehouse due to its native support for JSON and semi-structured data, which significantly reduced the need for manual adjustments.
Within the warehouse, Emplicit created a "Master Table" that unified data from various sources – Shopify orders, Google Analytics traffic, Amazon sales, Walmart transactions, and advertising spend from Meta and Google Ads – into a single, comprehensive view. By linking data through common keys like customer IDs and order numbers, the system enabled true cross-channel attribution.
The warehouse also included tailored data marts for specific business needs, such as sales analytics, inventory management, and marketing attribution. By storing raw "hitstream" data, Emplicit avoided the sampling limitations of standard analytics tools. This ensured decision-makers had access to accurate and complete insights.
How the Solution Was Implemented
With the new infrastructure in place, Emplicit tackled inefficiencies by standardizing data formats, securing API connections, and integrating ad spend with live inventory. The audit had revealed issues like inconsistent data formats and siloed information, so the implementation phase focused on unifying these elements into a seamless system.
Making Data Formats Consistent Across Platforms
Each marketplace had its own way of formatting data. For instance, Amazon used one date format, Walmart had different currency codes, and TikTok Shops followed unique product naming conventions. These inconsistencies made it hard to compare performance metrics effectively.
To address this, Emplicit introduced automated rules to standardize incoming data. Dates were converted to the MM/DD/YYYY format, currencies were unified into U.S. dollars (e.g., $1,234.56), and product identifiers were mapped to a single SKU system. A custom taxonomy-based normalization ensured metrics like units sold and conversion rates were consistent across all platforms. This process culminated in a Business Data Model (BDM) that clearly defined every table and column, ensuring data consistency and clarity.
Connecting Platforms with APIs
Instead of creating custom code for each platform, Emplicit utilized pre-built API connectors that only required user credentials to establish secure data flows. These connectors automatically pulled data from platforms like Shopify, Amazon, Walmart, and Google Analytics 4, eliminating the need for manual data imports.
Whenever possible, the team used native integrations to simplify the process and cut costs. For example, BigCommerce offers a direct integration with Google BigQuery, removing the need for third-party middleware. Kaustubh Joshi, Chief Data Officer at Overdose, highlighted this advantage:
"The benefit of BigCommerce is that it’s one of the first platforms to actually say ‘We offer an integration natively, so you don’t even need a third-party connector. You just configure your Google BigQuery credentials, put in your key and the data is replicated’".
To keep data up-to-date without exceeding platform rate limits, Emplicit implemented Change Data Capture (CDC) processes. These processes automatically identified and ingested only new or modified records. All data transfers were secured using HTTPS protocols, with encryption and data masking protecting sensitive information. With these secure, automated data flows established, the focus shifted to aligning PPC analytics with real-time inventory.
Connecting PPC Analytics to Inventory Data
One major challenge was ad spend being wasted on out-of-stock products due to the lack of real-time inventory data.
Emplicit resolved this by linking PPC platforms – like Google Ads, Meta, and TikTok – to a central data warehouse that held up-to-date inventory information. This required standardizing campaign naming conventions, which had previously made it difficult to match ads with their corresponding products. By enforcing strict naming rules and standardized UTM templates, the system now delivers consistent, actionable data.
The unified solution can automatically flag campaigns promoting low-stock items and even pause ads when inventory drops below a certain threshold. This integration bridged the gap between marketing and operations, addressing inefficiencies uncovered during the audit. For example, a mid-sized skincare brand saw a 38% boost in ROAS, a 44% reduction in CPA, and saved over 15 hours per week on manual reporting.
Results: Measurable Business Impact
Before vs After: Data Integration Impact on Ecommerce KPIs
After implementation, the changes in business performance were immediate and impactful. By removing data silos, Emplicit established a single source of truth, reconciling platform-reported conversions with first-party attribution models. This unified view brought consistency across all departments.
Improved Attribution Accuracy and Faster Decisions
The benefits of the unified system were clear almost immediately. Attribution accuracy jumped by 40%, thanks to full-funnel visibility that combined cost, conversion, CRM, and revenue data. Marketing teams no longer had to question which report to trust. With real-time data access, decision-making sped up by a factor of three, eliminating delays caused by manual processes. Additionally, the system prevented the "ripple effect" of inaccurate data spreading through the organization, keeping information reliable as it moved across teams.
Cost Savings and Operational Efficiency
Automating reporting processes significantly reduced manual work, saving teams dozens of hours each week – time that could now be spent on strategic planning. Integrated inventory checks also helped cut over $5,000 per month in wasted ad spend, ensuring every marketing dollar was spent on products that were actually available for purchase.
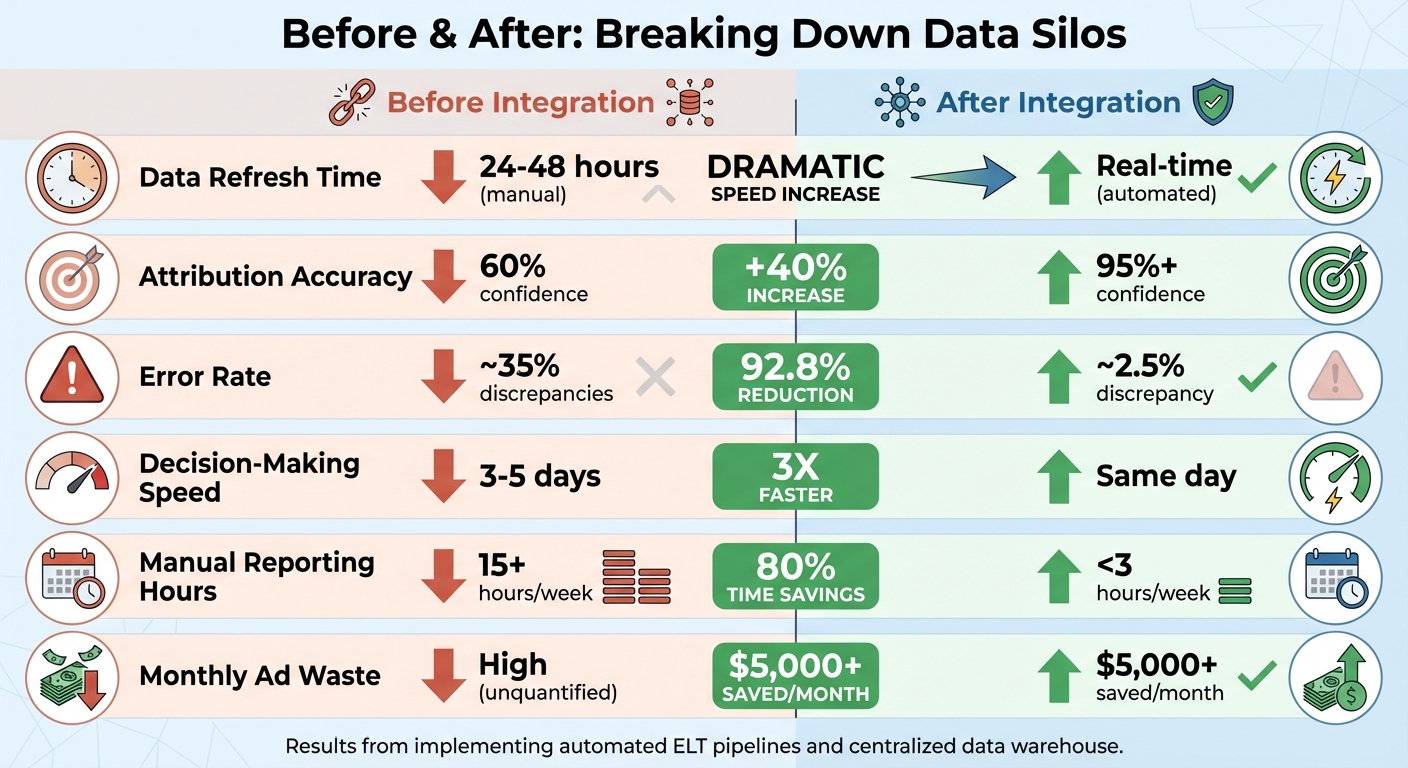
Before and After: KPI Comparison
| Metric | Before Integration | After Integration | Improvement |
|---|---|---|---|
| Data Refresh Time | 24–48 hours (manual) | Real-time (automated) | Dramatically faster |
| Attribution Accuracy | 60% confidence | 95%+ confidence | 40% increase |
| Error Rate | ~35% discrepancies | ~2.5% discrepancy | 92.8% reduction |
| Decision-Making Speed | 3–5 days | Same day | 3x faster |
| Manual Reporting Hours | 15+ hours/week | <3 hours/week | 80% time savings |
| Monthly Ad Waste | High | $5,000+ saved/month | Better allocation |
Eliminating data silos not only boosted operational efficiency but also improved financial performance. Teams were empowered to make faster, more informed decisions and shift their focus from time-consuming manual tasks to initiatives that drive growth.
Conclusion: What This Case Study Teaches Us
Data silos can drain 5–10% of a brand’s potential revenue. For ecommerce businesses operating across multiple marketplaces like Amazon, Walmart, and Target, fragmented data doesn’t just slow down reporting – it creates blind spots that can lead to costly strategic errors.
The key to solving this lies in both horizontal and vertical integration. Horizontally, brands need to connect data across various retailers. Vertically, they must integrate functional areas like media, operations, inventory, and sales. Without this unification, teams are often forced to rely on intuition rather than solid, data-backed insights.
"Today the most sophisticated questions are answered by data. So if you use data to solve your problems, you are doing the right thing." – Lukas Müller, Head of BI, reBuy
The audit revealed issues stemming from inconsistent data management, and Emplicit’s automated approach offers a clear solution. Automation eliminates manual processes, allowing teams to focus on strategy instead of spreadsheets. By creating centralized data warehouses and automated pipelines, businesses can shift their attention to identifying growth opportunities. The results speak for themselves: an 80% reduction in reporting time and over $5,000 saved monthly in wasted ad spend.
In today’s competitive ecommerce landscape, a unified data system – a single source of truth – is no longer optional. Brands that stick with disconnected systems will inevitably fall behind those leveraging faster, data-driven decisions. Whether managing two marketplaces or ten, a unified data infrastructure is the cornerstone of sustainable growth.
FAQs
What data should we connect first to break silos fastest?
To get started, focus on linking the most essential and impactful data sources – think e-commerce platforms, marketing channels, and customer data systems. By doing this, you’ll quickly gain a well-rounded view of performance and actionable insights. This approach also tackles data silos head-on. Prioritizing these areas ensures you’re zeroing in on the data that truly drives business success.
How can we improve attribution when customers buy on Amazon after clicking ads elsewhere?
To get a clearer picture of customer behavior, consider using multi-touch attribution (MTA). This approach examines customer interactions across all channels, even those outside of Amazon. Tools like Amazon Marketing Cloud and Amazon Attribution are especially useful for this. They allow you to track ad clicks and link them directly to purchases on Amazon, offering a deeper understanding of how your campaigns perform across multiple platforms.
What’s the minimum setup needed to pause ads for out-of-stock products automatically?
To stop running ads for products that are out of stock, you’ll need a system that can handle real-time inventory updates and automation. First, connect your inventory management system to your advertising platforms. Then, set up automation tools – like webhooks or real-time data feeds – that can instantly pause ads whenever your stock hits zero. This approach helps you save on ad spend and ensures customers don’t encounter unavailable products.