

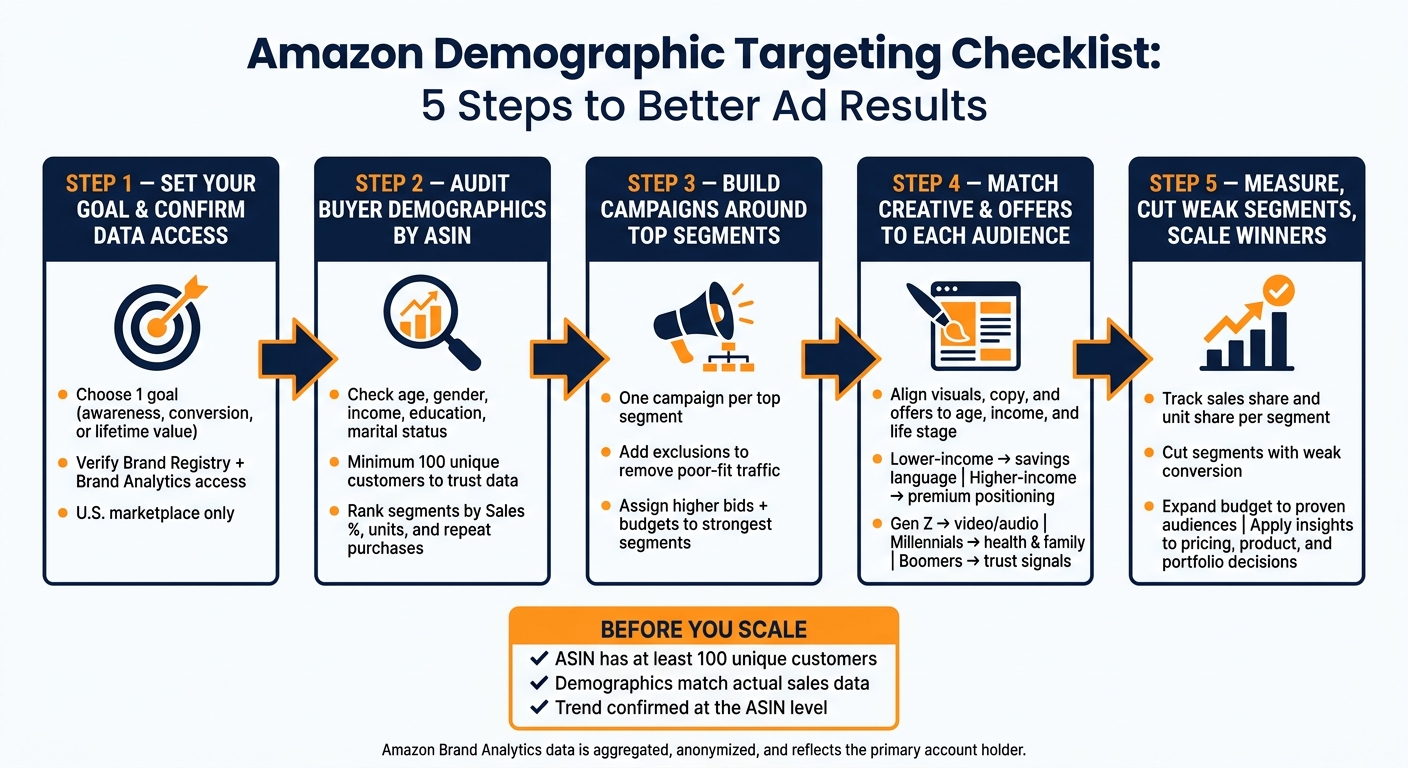
If I want better Amazon ad results, I need to stop guessing who buys and start checking the data. This checklist comes down to five steps: set one clear goal, confirm my Amazon demographic data, find the buyer groups tied to sales and repeat orders, build campaigns around those groups, and cut spend on weak segments.
Here’s the short version:
- I start with one goal: awareness, conversion, or lifetime value
- I check Amazon data fields like age, gender, income, education, and marital status
- I only trust segment reads when there’s enough volume, including Amazon’s 100-customer reporting threshold
- I compare buyer groups by sales, units, customer share, and repeat purchase behavior
- I split campaigns by audience, control bids and budgets, and remove low-fit traffic
- I match ad message, product page copy, and offers to the audience I’m trying to reach
- I review results on a fixed schedule and move spend to segments that show stronger sales share
A few facts matter right away. Amazon demographic data for Brand Analytics is aggregated and anonymized, it reflects the primary account holder, and some sales may fall into “Information Not Available.” So I should treat the data as a solid guide, not a perfect picture.
The main takeaway is simple: before I scale spend, I need to confirm that the segment is large enough, the ASIN has enough customer data, and the audience is tied to actual revenue – not just clicks.
| Step | What I check | What I do next |
|---|---|---|
| 1 | Goal and data access | Pick 2–3 segments to test |
| 2 | Buyer mix by ASIN and campaign | Rank groups by sales and repeat orders |
| 3 | Campaign setup | Split audiences, set bids, add exclusions |
| 4 | Ad and page message | Match copy, visuals, and offers to the segment |
| 5 | Performance review | Cut weak groups and add budget to winners |
If I use the checklist this way, I can make cleaner ad decisions and waste less budget.
Amazon Demographic Targeting Checklist: 5 Steps to Better Ad Results
How to Use Amazon Marketing Cloud to Improve Ad Targeting Fast
sbb-itb-e2944f4
1. Confirm your data sources and segment priorities
Once your goal is set, pause for a second and check the data behind your audience picks before you build anything.
Check which demographic fields are available
Use the Demographics dashboard to confirm which fields you can report on: age, household income, education, gender, and marital status. Age is broken into six brackets, and household income spans eight bands from under $50,000 to $250,000+.
For each segment, the dashboard shows:
- Unique customer counts
- Ordered product sales
- Ordered units
- Raw totals and each segment’s share of your overall numbers
There are a few limits you need to flag early. The data is aggregated, reflects the primary account holder, and hides products with fewer than 100 unique customers during the selected period. If you’re looking at slower-moving ASINs, use a longer date range.
Verify access to Amazon Brand Analytics and Amazon Ads insights
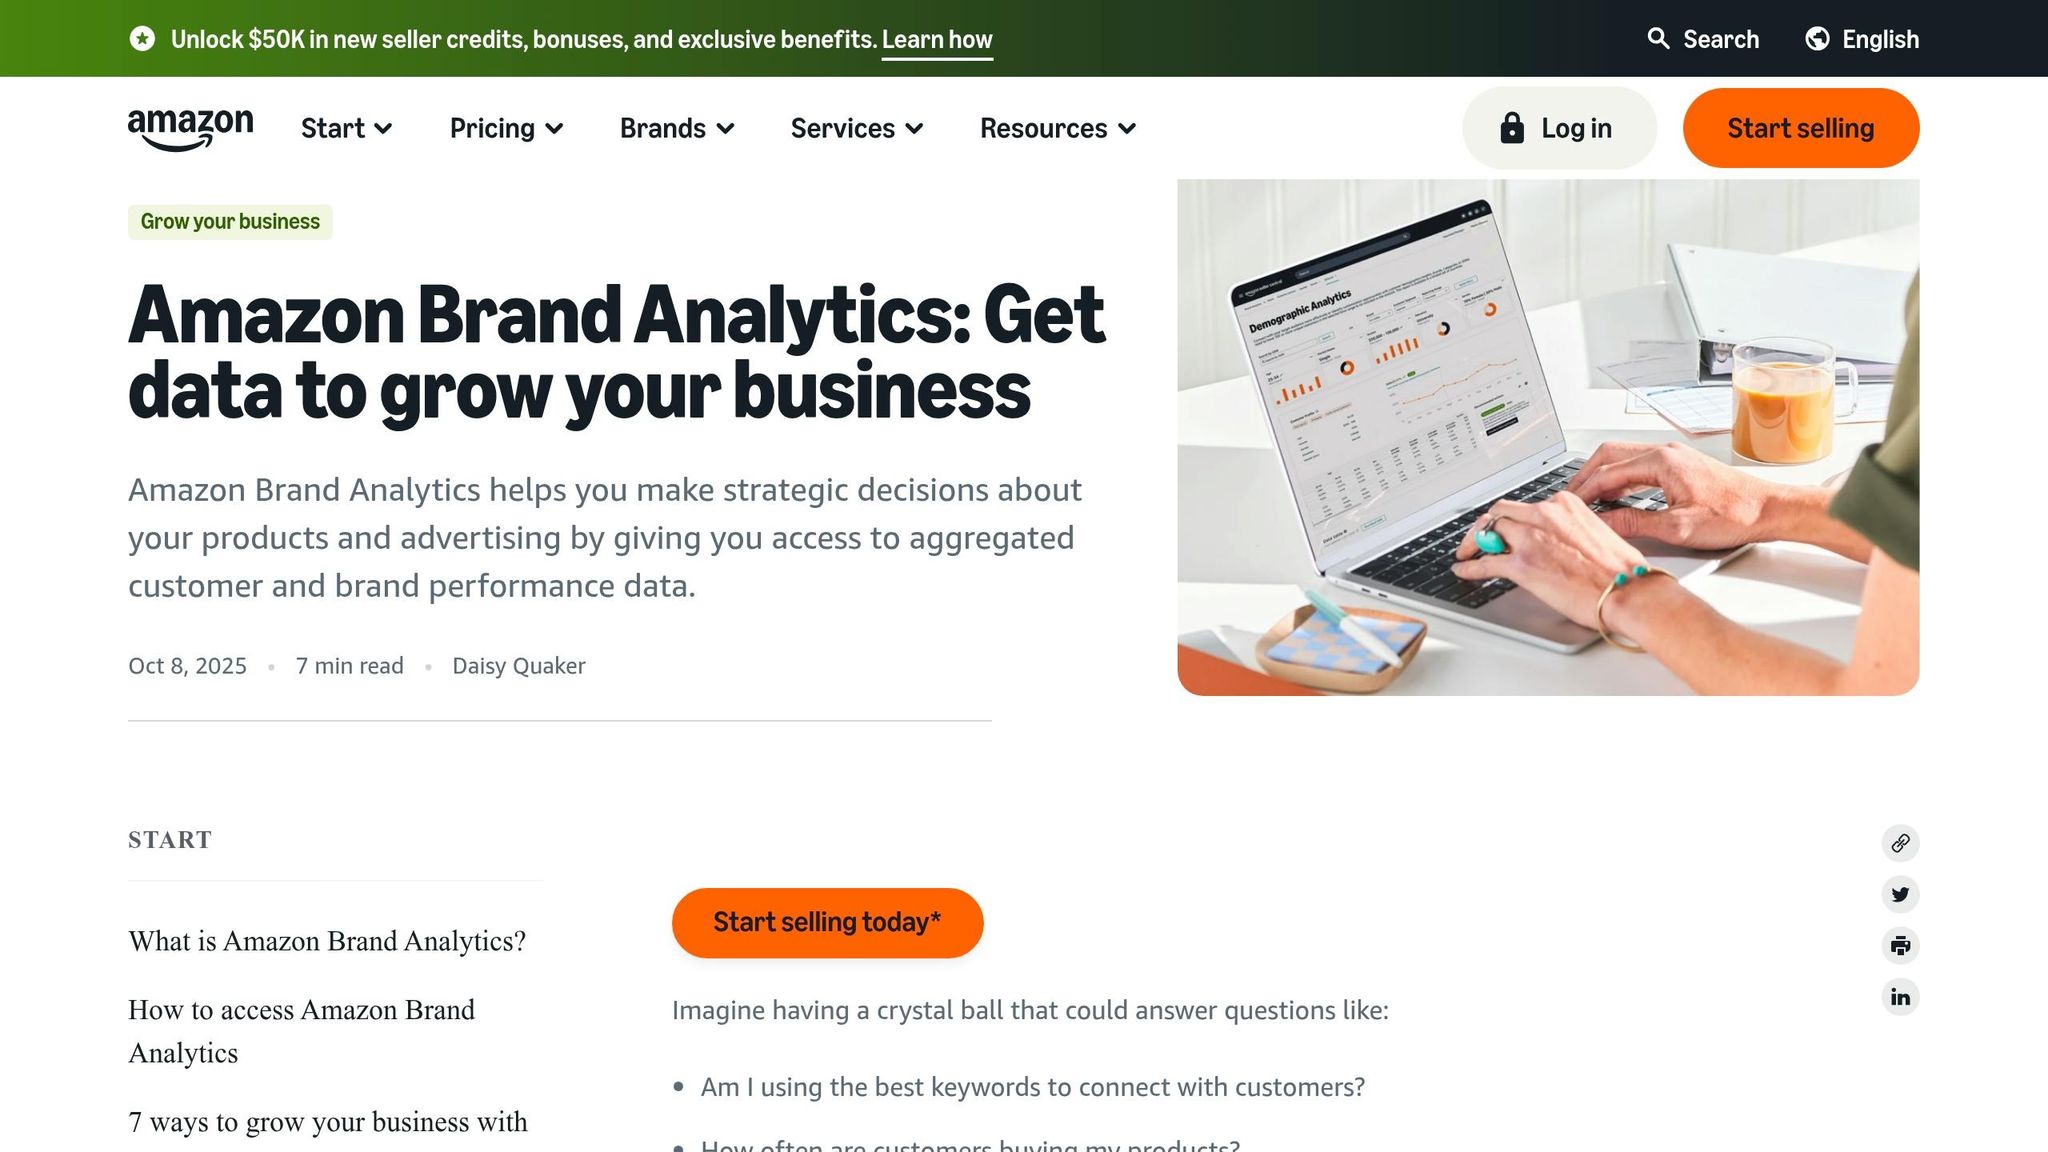
Before you dig in, make sure access is set up the right way. You need Brand Registry, a Brand Representative role, and Brand Analytics permission from the Primary Account Administrator. If you hit a permissions error, fix that first. Also, use the U.S. marketplace. The Demographics dashboard is available only on Amazon.com.
Once you’re in, use the "Include Information Not Available" toggle to measure sales that don’t have demographic attribution. This matters more than it may seem. If that bucket makes up a large share of sales, the report reflects only part of your buyer base, so use the findings as directional, not complete.
Choose which segments to test first
Start with the demographic brackets that already drive the largest share of ordered product sales across your top ASINs. Then match each segment to the outcome you care about most, like conversion, repeat purchase, or order value.
At that point, turn the data into simple hypotheses tied to business results. For example:
"Households earning $150,000–$174,000 are more likely to convert on our premium SKU"
"Customers aged 35–44 show stronger repeat purchase behavior on our consumable line."
Prioritize segments based on reach, product fit, and expected impact on conversion, sales, or repeat purchase behavior. Keep the first test tight. Two or three segments is usually enough to give you a clean read before you shape campaign structure, bids, and budgets around what you find.
2. Audit current buyers and connect demographics to performance
Review buyer demographics by top ASIN and campaign
Start with the two or three audience segments you picked earlier. Use them as your main comparison set.
Then open the Demographics dashboard and check your top ASINs one by one. The goal is simple: see whether each product brings in a different type of buyer. Amazon breaks this data out by age, household income, education, gender, and marital status, so product-level differences tend to show up fast.
If a product or campaign doesn’t show enough data, widen the reporting window until Amazon has enough unique customers to report on it.
It also helps to compare your best campaigns against your weakest ones. When the same segments keep showing up in stronger campaigns, that’s a good clue you’re looking at an audience worth more of your spend.
Match segments to repeat purchase and order value
The Demographics report shows unique customers, ordered product sales, and ordered units. Repeat Purchase Behavior adds the loyalty angle.
A simple way to read this data is to divide Ordered Product Sales by Ordered Units. That gives you an estimate of revenue per unit. From there, compare that number against each segment’s share of unique customers.
One more useful check: look at whether Ordered Product Sales % of Total is higher than Unique Customers % of Total. If it is, that segment is driving more revenue per customer than its size alone would suggest.
Export weekly, monthly, or quarterly data so you can look for patterns over time. That makes it easier to tell whether a segment performs well on a steady basis or just pops during certain periods.
Rank high-value audiences for budget allocation
Once the numbers are in front of you, rank each segment using three signals:
- unique customers
- Ordered Product Sales % of Total
- repeat purchase behavior
Then trim the list down to the two or three segments that show the best mix of scale, sales share, and repeat purchase. A shorter list makes the next step much easier, especially when you start building campaigns and reading performance cleanly.
Use age and gender as directional signals, not hard truth. Shared Amazon accounts can skew both data points. That ranking should guide which audiences get their own campaigns, which ones you exclude, and where the budget goes next.
3. Build campaigns, exclusions, and budgets around demographic value
Take the top-ranked segments from Step 2 and turn them into separate campaigns with their own budget rules.
Set up demographic targeting by campaign objective
Keep each top segment in its own campaign or ad group so you can see performance clearly. The idea is simple: create one campaign or ad group for each top segment and each objective.
That split makes it much easier to spot what’s working and what’s dragging results down. Once the structure is in place, start filtering out traffic that doesn’t fit.
Create audience groups and exclusion rules
Build audience groups from the top segments you found in Step 2. Then keep your negative keyword lists and exclusion rules up to date so poor-fit traffic stays out of the campaign. That can cut wasted spend and improve click-through rates.
With cleaner audience groups, you can put more of your spend behind the segments that convert best.
Assign bids, daily budgets, and frequency limits
Put more budget and higher bids behind your strongest segments. If you have income data, use it to point premium bundles or higher-priced products toward audiences that are more likely to convert.
For narrow, high-value audiences, set frequency limits so people don’t see the same ad too many times. That helps reduce audience burnout. And when you run A/B tests, change just one variable at a time so the results stay clear.
4. Adjust creative, offers, and landing experience for each audience
Once you’ve set your segments and budgets, use that same audience data to shape what shoppers see after the click. Demographic targeting only works when the promise in the ad, the page experience, and the offer all line up with the audience.
Match copy and visuals to age, income, and life stage
Use images that reflect the buyer’s age and life stage. For example, if your Amazon Brand Analytics data shows a strong share of older buyers, update your A+ Content and Sponsored Brand visuals to show older models instead of generic stock photos.
Income should guide how you frame value. Lower-income shoppers may react better to competitive pricing and savings language, while higher-income shoppers may lean toward premium positioning. You can also adjust copy complexity by education level so the message feels clear and useful.
Gen Z responds to video and audio, while Millennials tend to respond to themes tied to health, wellbeing, and family and community support. Baby Boomers often respond better to mindset-led messaging than age-based appeals.
Update product pages and Store content to reduce friction
Carry the same demographic promise from the ad into the detail page and Store. The page should feel like a natural next step from the ad, not a bait-and-switch. Add proof that helps reduce hesitation – reviews, ratings, and testimonials matter a lot for shoppers who want reassurance before they buy. If your audience needs more detail, use the Brand Store for richer explanations or blog-style content.
Align promotions with U.S. shopping patterns
Use this as a quick reference for aligning offers and content.
| Segment | Creative and landing-page emphasis |
|---|---|
| Lower-income shoppers | Competitive pricing and savings language |
| Higher-income shoppers | Premium positioning |
| Gen Z | Video, audio, sustainability, and social impact |
| Millennials | Health, wellbeing, and family and community support |
| Baby Boomers | Mindset-led messaging and trust signals |
5. Measure results, scale winners, and apply insights across the business
Track performance by segment with clear decision rules
Once your creative and landing-page changes are live, check your demographic reports to see which audiences actually responded.
Review those reports on a set schedule. For each segment, track sales, units, and share of total by segment. And hold off on making changes until the report passes Amazon’s 100-unique-customer minimum.
You should also turn on the "Include Information Not Available" toggle in the dashboard. That view shows how much of your audience sits in the "Information Not Available" bucket, which helps you judge whether the known data gives you a fair read on performance.
Cut weak segments and expand proven audiences
This is where the numbers start to matter. Don’t just file the report away. Use it to move spend.
Segments with the highest sales share and unit share are your strongest performers. Increase bids and budgets there first.
If a segment brings traffic but shows weak sales share or poor conversion, pull back. Lower bids or add those audiences as exclusions. Otherwise, weak demographics can keep eating budget in the background.
Apply Amazon demographic insights beyond advertising
When you find winning segments, don’t stop at ad accounts. Use those patterns across the business.
Demographic insights can guide pricing strategy, product portfolio decisions, and product development. If one audience keeps buying more often, converts at a better rate, or drives more units, that signal can shape how you position offers, which products you push, and what you build next.
Conclusion: Review the checklist before you scale spend
Use this checklist as your last gate before you scale. Before you add more budget, run through it again. If those pieces aren’t lined up yet, spending more usually just means wasting more.
Before scaling, make sure the ASIN has at least 100 unique customers, compare Demographics with actual sales, and confirm the trend at the ASIN level.
Think of demographic targeting as a review cycle, not a one-time setup. Check reports on a regular schedule, test one variable at a time, and adjust segment priorities as performance shifts. Then recheck those segments on a fixed cadence before moving more spend.
FAQs
What if my ASIN has under 100 customers?
If your ASIN has fewer than 100 customers, you won’t get detailed demographic data for that product. Amazon’s Demographics dashboard and reports only show data for products with at least 100 unique customers during the selected time period.
If you need more insight, try expanding the report range to monthly or quarterly. That gives customer data more time to add up, which may help the product meet Amazon’s reporting threshold.
How often should I review demographic performance?
Review demographic performance as often as you need to steer your marketing strategy. You can pull the demographics report weekly, monthly, or quarterly, and it updates on those same schedules.
That gives you a steady way to check who your customers are and tweak campaigns and product decisions based on what the data shows.
Which demographic segments should I test first?
Start with the segments in Amazon’s demographics report: age groups, household income, gender, and marital status.
First, look at sales by age group to see which groups respond best. Then use household income to shape your pricing strategy. After that, use gender and marital status to sharpen your customer personas and fine-tune your messaging.