
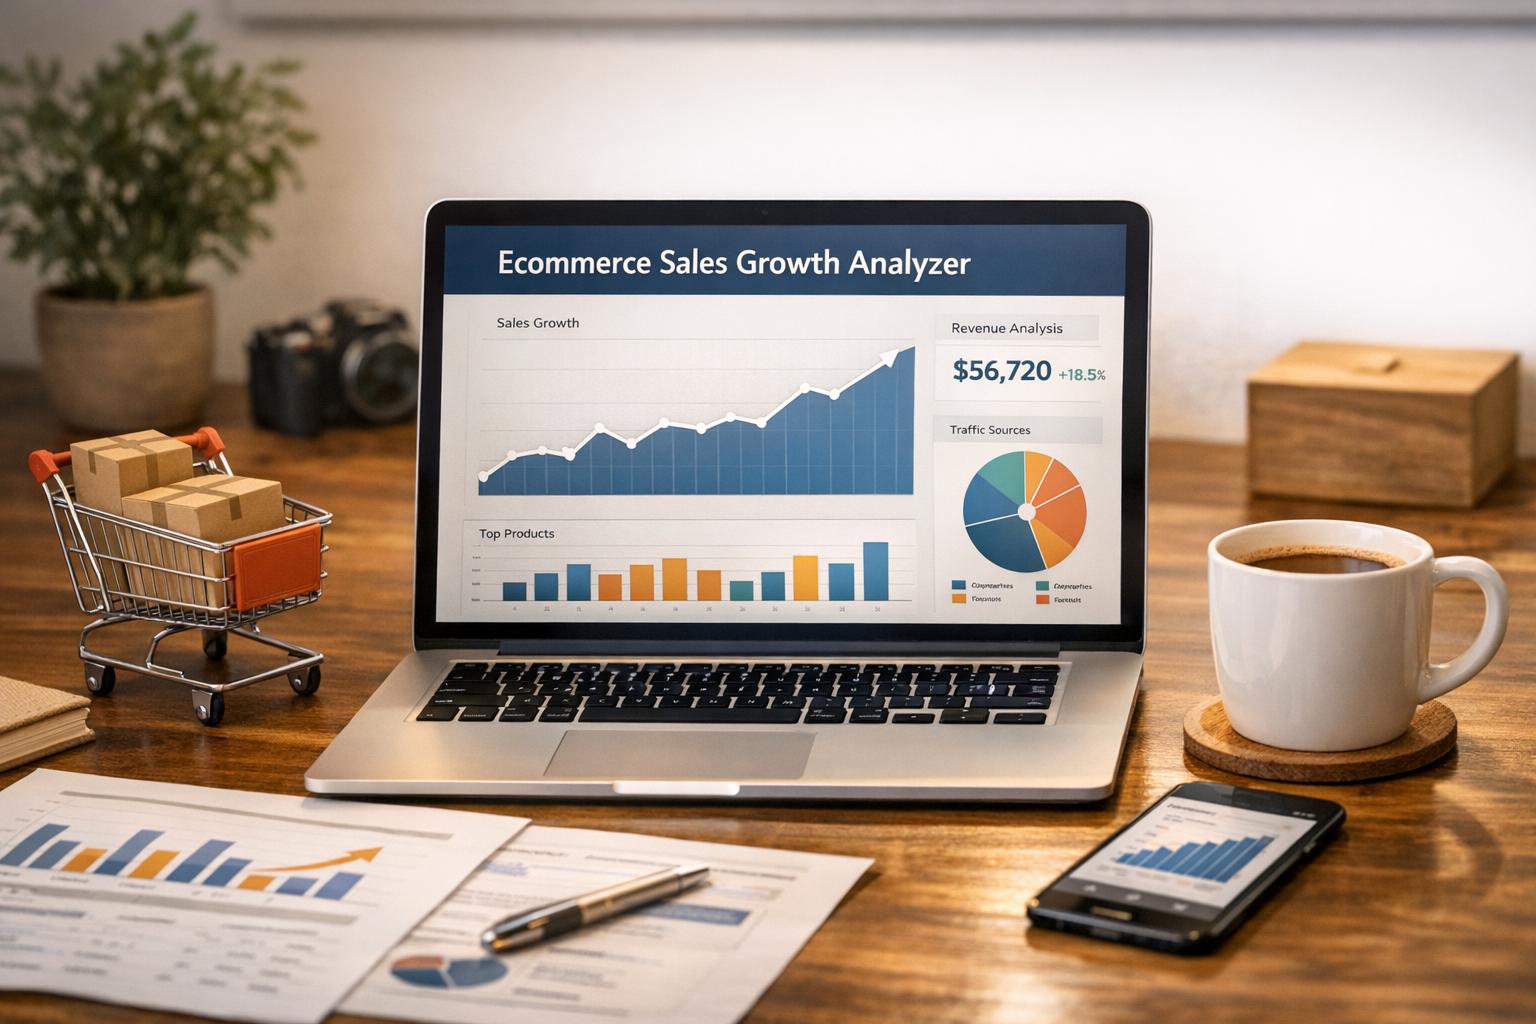
Grow Your Online Store with an Ecommerce Sales Tracker
Running an ecommerce business is exciting, but keeping tabs on your performance can feel overwhelming. That’s where a tool like our Ecommerce Sales Growth Analyzer comes in handy. It’s built for online sellers who want to understand their numbers without drowning in spreadsheets. By simply inputting your monthly revenue and a few optional details, you can unlock a treasure trove of insights to help your store thrive.
Why Tracking Sales Trends Matters
Every online shop has ups and downs, but do you know what’s driving yours? Monitoring month-over-month growth lets you spot patterns—maybe a holiday spike or a slow season—and plan accordingly. A solid sales analysis tool breaks down complex data into clear visuals like line graphs, so you can see at a glance where your revenue is headed. Plus, with tailored suggestions based on your stats, you’ll have actionable steps to improve. Whether you’re a small Etsy seller or managing a larger Shopify store, digging into your performance metrics is the key to scaling up. Take control of your business today with a resource designed to simplify and strategize.
FAQs
What if I don’t have data for all months?
No worries! You’ll need to input at least 6 months of sales data to get meaningful results, and the tool will prompt you if anything’s missing. For optional fields like expenses or product counts, just leave them as 0 or blank, and we’ll still calculate the basics like growth percentages and revenue trends. It’s designed to work with what you’ve got.
How does the tool calculate profit margins?
If you provide monthly expenses, the tool subtracts them from your sales to figure out your net profit, then expresses that as a percentage of your revenue. It’s a straightforward way to see how much you’re actually keeping after costs. If you skip entering expenses, we’ll focus on revenue growth and other metrics instead.
Can this tool help me spot underperforming months?
Absolutely, that’s one of its best features! After analyzing your data, it highlights dips in sales or growth with simple charts and even offers tips—like running a promo if a specific month lagged. You’ll get a clear picture of where things slowed down and ideas to turn it around.