
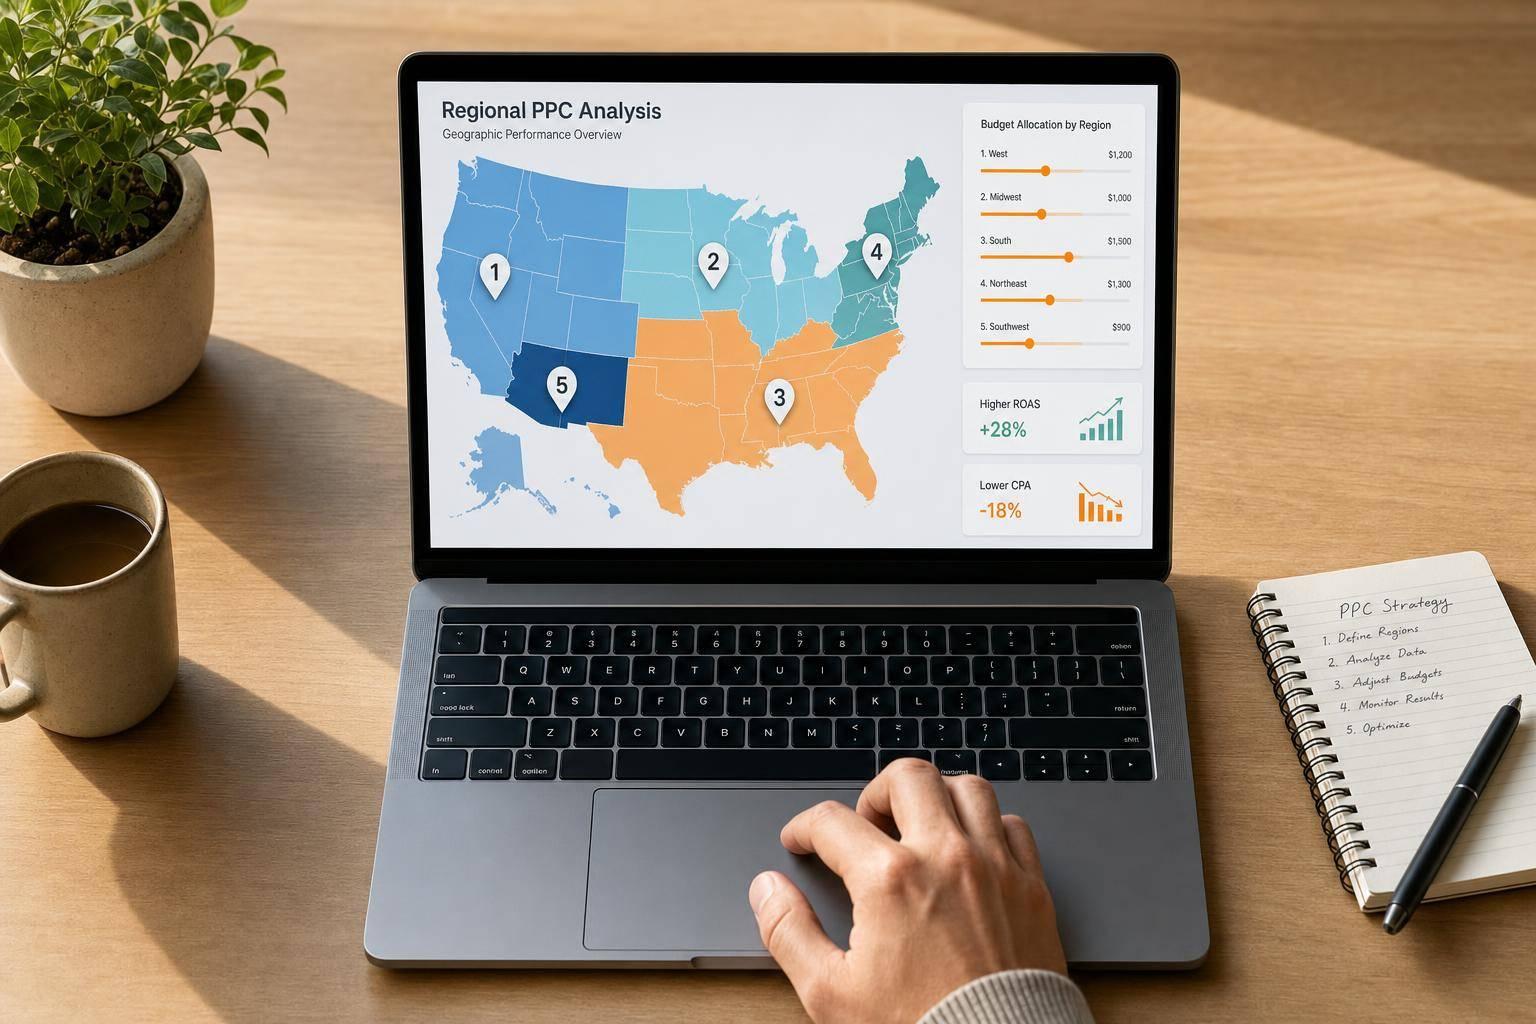
If you spend the same PPC budget across every region, you will miss where profit is strongest. I’d use geographic and demographic data to see which states, metros, cities, and ZIP codes bring the best ROAS, CPA, and AOV – then shift budget based on that.
In plain terms, here’s the process:
- Pull location data for the last 30 to 90 days
- Add audience data like age, gender, and household income
- Clean the numbers so time zones, revenue, and conversion tracking match
- Group regions into tiers such as top, middle, and poor performers
- Change bids, budgets, and campaign setup based on those tiers
- Review results often so weak regions don’t keep wasting spend
This matters because one area can have a high conversion rate and low shipping cost, while another burns budget with low return. A ZIP code may look strong on clicks, but weak on revenue. A metro may support higher bids because average order value is higher. That’s the level I’d look at before making changes.
A few points stand out right away:
- Use User Location data in Google Ads to see where people were when they clicked
- Check more than clicks and CTR; focus on ROAS, CPA, conversion rate, revenue, and AOV
- Filter out thin data, because small samples can skew decisions
- Split campaigns only when regions need separate budgets, bids, or messaging
- Compare results to a baseline before expanding spend
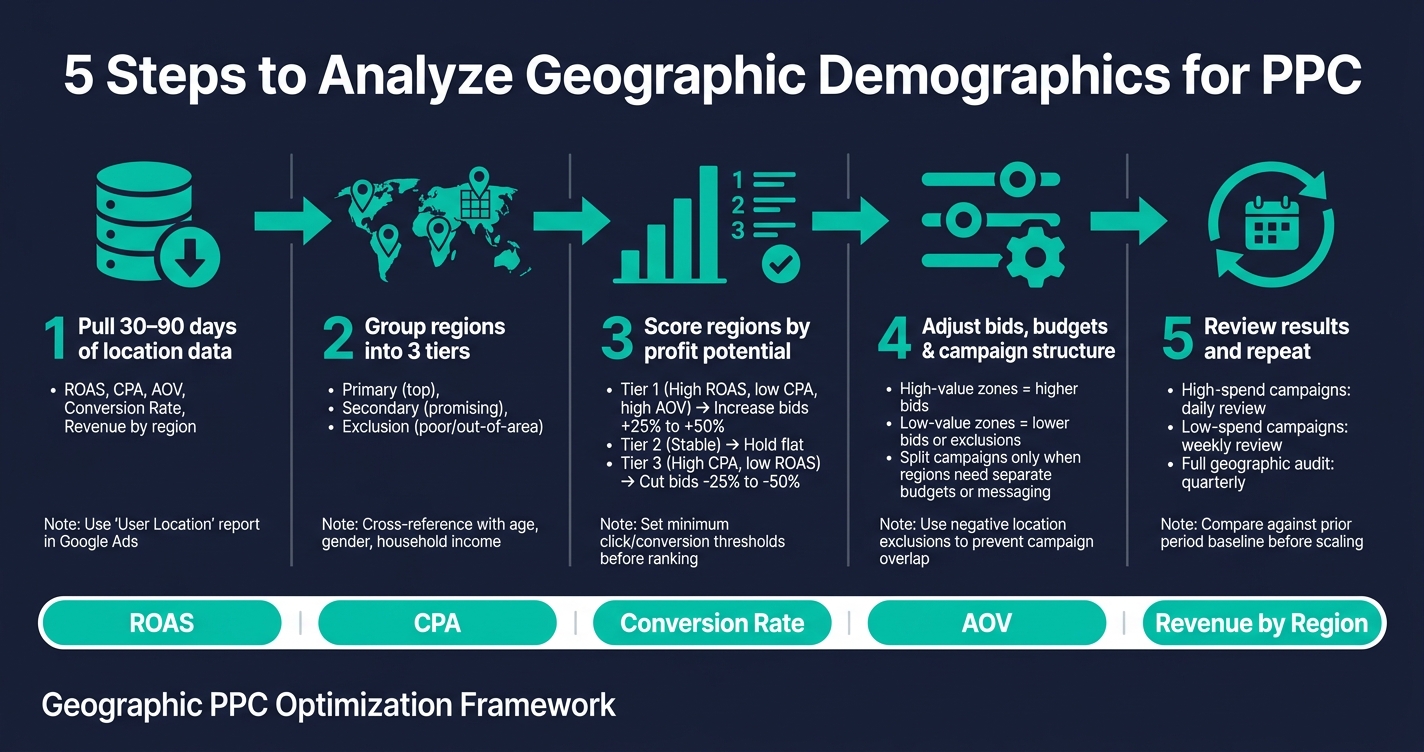
5-Step Geographic Demographics Analysis for PPC
Demographics Targeting In Google Ads | Ajay Dhunna

sbb-itb-e2944f4
Quick comparison
| Step | What I’d do | What I’d look for |
|---|---|---|
| 1 | Collect data | ROAS, conversions, revenue by region |
| 2 | Build segments | Top, middle, and poor-performing areas |
| 3 | Rank regions | CPA, AOV, conversion rate, ROAS |
| 4 | Apply changes | Bid cuts, bid increases, budget shifts |
| 5 | Review and repeat | Trend changes by state, metro, city, or ZIP |
Bottom line: I’d put more budget into places that sell well, cut back where performance is weak, and keep checking the map as demand changes.
Step 1: Collect the right geographic and demographic performance data
Before you change a single bid or budget, make sure your data is solid. If your location reports don’t match, spend can drift into the wrong regions fast.
Export location data from PPC and analytics tools
Start by pulling performance data by state, metro area (Designated Market Area, DMA), city, and ZIP code for the last 30 to 90 days. From your PPC platform, export impressions, clicks, CTR, CPC, conversions, and ROAS.
Then add the business metrics that tell the deeper story: conversion rate, customer acquisition cost (CAC), average order value (AOV), and customer lifetime value (CLV) from analytics and internal data. In GA4, use geographic reports to check revenue by city and demographic reports to review sessions by age and gender.
There’s one Google Ads detail that matters a lot here: use the "User Location" report instead of the "Locations" report. The User Location report shows where people physically were when they clicked, even if those places aren’t in your active targeting. That gives you a much cleaner picture of what’s happening.
Keep your location fields consistent across PPC and analytics. If one report uses city names and another uses a different format, segmentation gets messy in a hurry.
Add demographic fields that affect buying behavior
Stick to traits you can act on inside the ad platform: age, gender, and household income bands. Don’t pile on extra fields just because they’re there. Focus on the combinations that shift conversion rate or AOV.
For instance, a ZIP code might look like a star at first glance. But the real driver could be one income band that buys more often or spends more per order. That kind of pattern can shape bid adjustments and sharpen your audience segments.
Clean the dataset before analysis
Before you dig into the numbers, check the basics. Verify conversion tracking, standardize revenue in U.S. dollars, and align reports to the correct U.S. time zone. If campaigns run across multiple time zones, day-level reporting can get skewed when the reporting window isn’t standardized.
Also keep an eye on small-sample noise in smaller geographies or narrow demographic slices. A tiny pocket of data can look amazing one week and fall apart the next. Filter out locations with too little volume before you rank performance.
Once the dataset is clean, group locations into segments you can actually use in campaign settings.
Step 2: Build geographic segments you can use in campaigns
Turn clean location data into segments you can actually use in campaigns.
Group locations by market value and scale
A simple three-tier setup works well: Primary for top-performing regions, Secondary for regions with promise, and Exclusion zones for poor performers or places outside your shipping or service area.
The budget should follow that same structure. Regions that drive the most conversions again and again should get the biggest share of spend. This also makes Step 3 much easier, because you already have a clear way to sort regions by performance.
Cross-reference location with demographic traits
Bring in demographic traits only when they change how people buy. A simple matrix is usually enough, like state or metro by income tier, or metro by age group.
For high-ticket items, grouping ZIP codes by household income helps you focus ads on areas with the buying power to convert. A high-income urban cluster with strong conversion rates and above-average AOV is not the same as a mid-income suburban area with high volume but lower margins. They may look similar at a glance, but they need different treatment in your campaign structure.
Use naming conventions that match PPC execution
Your labels should match how campaigns are built, not how a spreadsheet is organized. Names like "Presence-Only", "High-Income Tier," or "West Coast Regional" keep reporting tied to optimization goals.
Use the same labels across reports, bids, and campaign structure. That way, when you look at performance, you don’t have to stop and decode what each segment means.
Step 3: Find High-Value and Low-Value Geographic Clusters
Now it’s time to sort your regions by profit potential and budget efficiency. Once you’ve built your geographic segments in Step 2, compare them side by side and see which areas deserve more spend, which ones should stay steady, and which ones are dragging performance down.
Rank Regions by Efficiency and Revenue Impact
Look at each segment through the metrics that matter most: conversion rate, CPA, ROAS, average order value (AOV), and revenue. That mix gives you a much better read on a region’s worth than activity alone. A market can drive plenty of clicks and still not make money.
You can also use CTR and impression share as supporting signals. They help you gauge whether a strong region may still have room to grow, especially if performance is solid but visibility isn’t maxed out yet.
Before you rank anything, set minimum thresholds for clicks and conversions. Thin data can point you in the wrong direction.
Separate Strong Locations from Weak Ones
Use clear bid ranges for each tier so your next move is obvious. Push bids up in high-value regions, pull them back in low-value ones, and cut poor performers when the numbers call for it.
For mid-tier regions, keep spend steady for now. Then test localized creative before you scale. Sometimes a region isn’t weak – it just needs ads that feel more local and relevant.
Geographic Performance Comparison Table
Use impression share only to confirm whether top-tier regions still have room to scale. These tiers map straight to bid, budget, and exclusion decisions. Use the matrix below to turn performance rankings into campaign actions.
| Geographic Tier | Performance Characteristics | Recommended Action |
|---|---|---|
| High-Value (Tier 1) | High ROAS, low CPA, high AOV | Increase bids (+25% to +50%); dedicate budget; test localized creative |
| Mid-Tier (Tier 2) | Average efficiency, stable volume | Hold spend flat; test localized ad copy; monitor for growth signals |
| Low-Value (Tier 3) | High CPA, low ROAS, low conversion rate | Reduce bids (-25% to -50%); exclude underperforming ZIP codes |
| Limited Data | Limited volume, variable performance | Use a small budget share and set higher conversion thresholds before scaling |
Step 4: Apply Insights to Targeting, Bids, and Campaign Structure
Step 3 rankings only matter if they change how you run the account. The point is simple: take what you learned in Step 3 and turn it into bid changes, budget shifts, and cleaner campaign structure.
Adjust Bids and Budgets by Region
Apply Step 3 tiers straight to bids and budgets: high-value zones (higher bids), neutral zones (neutral bids), and low-value zones (lower bids or exclusions).
Increase bids in places where location and demographic fit lead to strong ROAS and AOV. But don’t look at ROAS in isolation. If shipping or inventory limits affect a region, account for those costs before you push bids up. A ZIP code can post strong ROAS and still cut into margin if fulfillment costs are too high.
Budget should follow performance. Shift more spend to regions that keep beating the account average on ROAS and conversion rate.
If bid adjustments stop doing the job, that’s usually the signal to move to separate campaign control.
Split Campaigns When Regions Need Separate Control
Don’t split campaigns just because one region looks a little better than another. Use bid modifiers when performance gaps are modest. Split campaigns when a region needs its own budget, bids, creative, or landing page.
This works best when regional demand, shipping costs, or messaging needs are different enough to affect results. Keep similar markets grouped together, and break out only the regions that clearly behave in their own way.
When you do create separate campaigns, use negative location exclusions to stop overlap. For example, if you build a Top Cities campaign and a Rest of State campaign, exclude those top cities from the second campaign so the two don’t compete against each other.
Once the structure is in place, the next step is matching ads and operations to what each region wants.
Align Ads and Operations with Regional Demand
Use geography to decide where to spend. Use demographics to shape what you say. Then use regional demand signals to tailor headlines, offers, and landing pages.
That local match can improve conversion, especially when the message lines up with what people in that area are looking for.
Regional demand should also guide inventory, promotions, and fulfillment before you scale spend. PPC shouldn’t work in a vacuum. Tie campaign decisions to inventory and fulfillment so ad spend supports margin, not just traffic.
Step 5: Monitor Results and Repeat the Process
Once your bid and account structure changes are live, the next job is simple: check which regions actually got better.
That matters because geographic analysis isn’t a one-and-done task. Markets change. Seasonality shifts demand. And the regions that looked strong last quarter can cool off fast.
Set a Review Cadence and Testing Rules
Review higher-spend campaigns daily and lower-spend campaigns weekly. On top of that, run a deeper geographic review every quarter to spot longer-term growth and efficiency gains.
For most accounts, quarterly location and modifier checks are enough.
When you test bid, budget, and targeting changes, compare results against the prior period before you scale anything. Use controlled tests like A/B tests or geo-lift tests to confirm the impact of each adjustment.
If impression share is capped, don’t just push more spend into the same market. Move into nearby locations instead.
Five-Step Implementation Checklist
Use the checklist below to make each review follow the same repeatable workflow.
| Step | Action | Key KPIs to Track |
|---|---|---|
| 1. Collect data | Pull location reports from your PPC platform and analytics tools | ROAS, conversion rate, revenue by region |
| 2. Build segments | Group locations by market value and demographic fit | AOV and LTV by segment |
| 3. Rank clusters | Score regions by efficiency and revenue impact | ROAS, CPA, conversion rate |
| 4. Apply changes | Adjust bids, budgets, campaign structure, and ad copy | CPA vs. target, impression share |
| 5. Monitor results | Track performance against baselines and flag anomalies | Revenue by region, ROAS trend |
Conclusion: Focus Spend Where Geographic Demand Is Strongest
Repeat the process and shift spend by region so your best markets get more of the budget. Review, adjust, and repeat – that’s how geographic demographic analysis turns into a long-term edge.
FAQs
How much data is enough to trust a region?
It comes down to a simple trade-off: more detail can mean less statistical stability.
For automated advertising, AI usually needs a potential audience of 2 to 4 million to spot likely customers with any consistency. If you go too narrow in smaller geographic segments, the numbers can get shaky fast. In those cases, smoothing methods or Bayesian priors can help steady the estimates.
For long-term analysis, set boundaries based on dependable data sources and documented performance metrics. Then, after 1 to 2 months, review location reports and look for statistically meaningful patterns in conversions and cost efficiency.
When should I split regions into separate campaigns?
Split regions into separate campaigns when that gives you better control over budget, reporting, and performance.
This makes sense when regions sit in different time zones, matter more to the business, or perform closely enough to group together so you can assign budget with more control.
Which metric matters most for geographic PPC decisions?
ROAS is the main metric for geographic PPC decisions because it connects local campaign results to profit.
Conversion rate, cost per acquisition, and average order value still matter. But the way to read them is simple: compare each one against your target ROAS to decide whether a location should keep its budget or get more of it.