Struggling to turn Amazon traffic into sales? If your product listings are getting views but not purchases, the problem likely lies in your conversion rate. The good news? Amazon provides a powerful tool in Seller Central to diagnose and fix these issues: the Detail Page Sales and Traffic Report.
Here’s why this report matters and how it can help you:
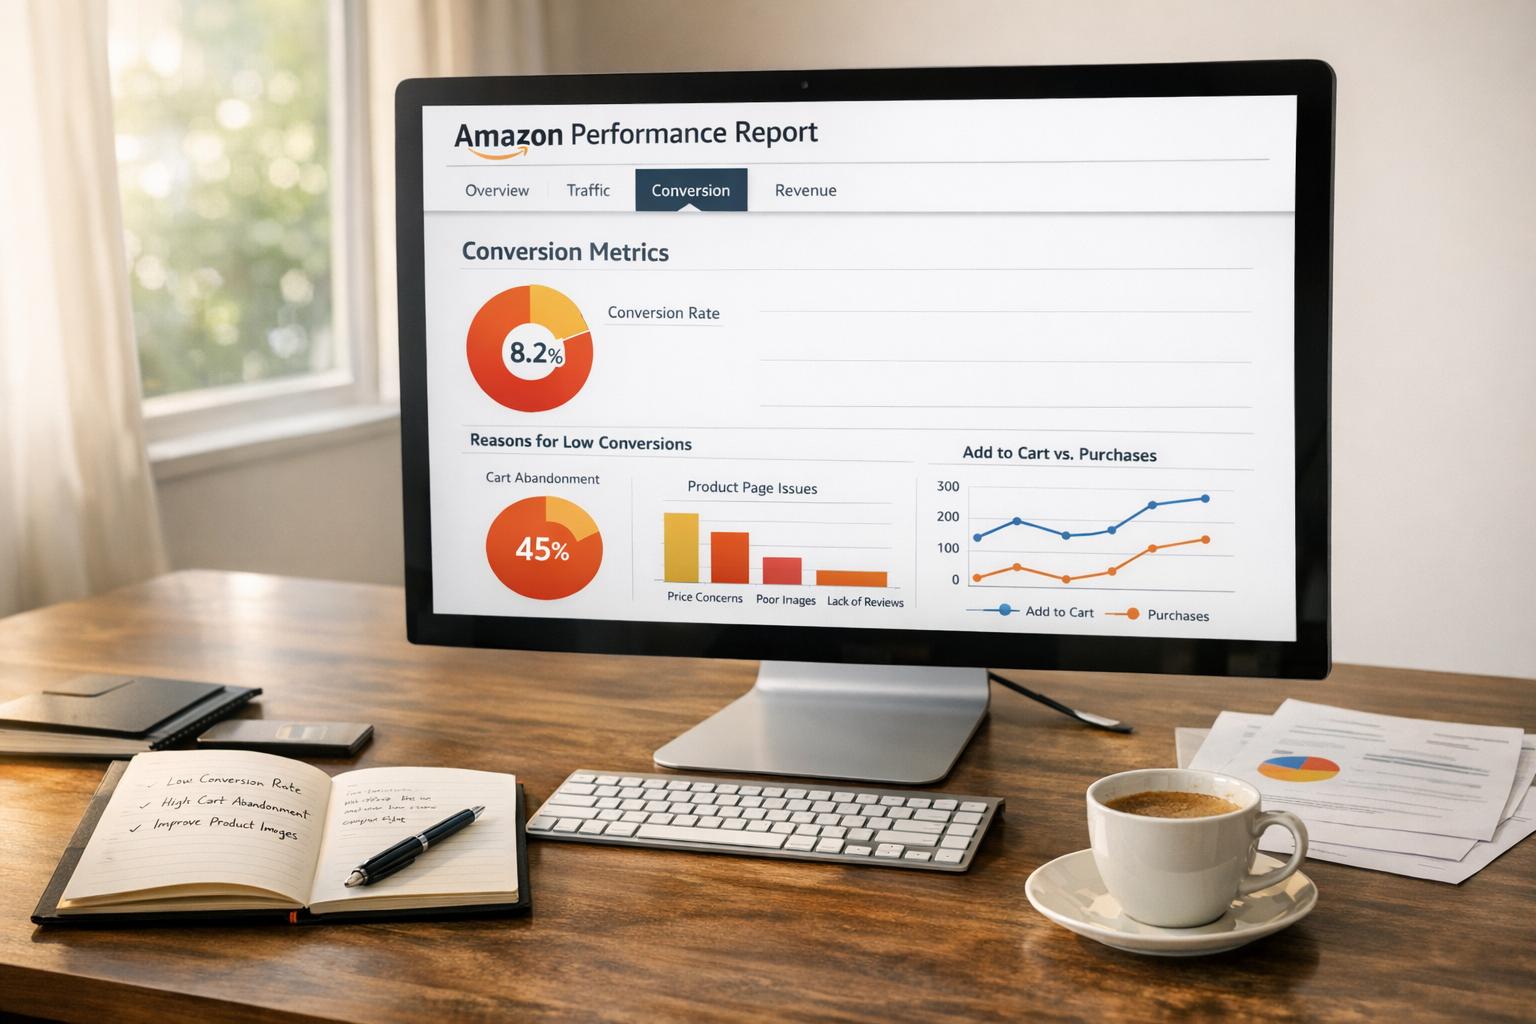
- Key Metric: It tracks Unit Session Percentage (Amazon’s term for conversion rate), showing how many visitors actually buy.
- Insights: It highlights problems like poor images, unclear descriptions, uncompetitive pricing, or low Buy Box Percentage.
- Actionable Data: Compare traffic, conversions, and trends by ASIN to pinpoint underperforming listings.
Fix the problem, don’t just throw money at ads. This report shows you where to improve your listings – like product images, titles, bullet points, or pricing – so you can boost conversions before increasing ad spend.
Quick Takeaways:
- A healthy conversion rate is typically 10–15%. Below 8%? Your listing needs work.
- 80% of conversion issues stem from listing quality, not advertising.
- Optimizing your product page can lead to massive sales growth, even with small improvements.
Amazon sellers who focus on data-driven changes using this report can turn clicks into purchases and improve their bottom line. Let’s dive into how this works.
Amazon Product Listing Optimization Secrets (2026 Step by Step)
What Is the Detail Page Sales and Traffic Report?
If you’re looking to turn traffic into sales, the Detail Page Sales and Traffic Report is your starting point. Found in Amazon’s Business Reports, this product-level report provides performance insights for individual ASINs. Unlike broader account-level reports that focus on overall trends, this report drills down into the specifics of each product listing.
It works by comparing two key metrics: Sessions (visits) and Unit Session Percentage (conversion rate). For instance, if you’re seeing high traffic but low conversions, it could mean your images, pricing, descriptions, or reviews need attention. On the flip side, if traffic is low but conversions are strong, your product content is doing its job – you just need to attract more visitors through advertising or better SEO strategies.
"Detail Page Sales and Traffic – this is the most helpful report as everything is shown by product ASIN."
– Chris Turton, Ecommerce Consultant
The report also highlights your Buy Box Percentage. If this metric falls below 100% for private label products, it may indicate issues like stock shortages or increased competition. With access to up to two years of historical data, you can identify trends and seasonal patterns to refine your strategy.
Next up, let’s dive into one of the most important metrics in this report: Unit Session Percentage – Amazon’s version of conversion rate.
Understanding Unit Session Percentage
Amazon uses the term Unit Session Percentage to describe its conversion rate. This is calculated by dividing the number of units sold by the total number of unique sessions (visits) your product page receives. For example, if 100 people visit your product page and 10 make a purchase, your Unit Session Percentage would be 10%.
This metric provides a clear picture of how convincing your listing is once a potential buyer lands on it. A well-optimized listing typically sees conversion rates between 10% and 15%, while the platform average hovers around 9.7%. If your conversions are below 8%, it’s a clear sign that some aspects of your listing need improvement.
"Unit Session Percentage – Amazon’s wording for ‘conversion rate’. This is one of the most crucial metrics in this report."
– Chris Turton, Ecommerce Consultant
The report breaks down conversions into two categories: total conversions (including both regular consumers and business buyers) and a separate B2B conversion rate. It’s also worth noting the difference between Sessions and Page Views: Sessions count unique visitors within a 24-hour period, while Page Views include every time a page is loaded.
How to Find and Open the Report
To access this report, you’ll need a Professional selling plan, which costs $39.99 per month. Here’s how to find it:
- Log in to Amazon Seller Central.
- Hover over the Reports tab in the main navigation menu and select Business Reports.
- In the left-hand sidebar, look under the "By ASIN" section. If the sidebar is hidden, move your mouse to the far left edge to reveal it, then click the vertical Reports tab to pin the menu.
- Choose the report you need. For example, the Detail Page Sales and Traffic by Child Item report provides data on individual product variations (like different sizes or colors), while the Parent Item report combines data from all variations.
- View the report directly on-screen or download it as a CSV file for further analysis in tools like Excel or Google Sheets.
Keep in mind that the data in these reports typically has a 24- to 48-hour lag, so it won’t reflect real-time activity. But with these steps, you’ll have everything you need to make informed decisions and optimize your listings effectively.
How to Read Your Conversion Rate Numbers
Amazon Conversion Rate Benchmarks: What Your Numbers Mean
Once you’ve accessed your Detail Page Sales and Traffic Report, the real challenge begins – making sense of the data. The Unit Session Percentage is a key metric, showing how many visitors are converting into buyers. But without context, it’s just a number on a screen.
To get the full picture, compare your Unit Session Percentage to industry averages. For instance, if your rate is 6% but the average for your category is 12%, you’re missing out on potential sales. On the other hand, for high-ticket items priced over $100, a 5% conversion rate might be competitive because customers often take more time to decide on expensive purchases. Establishing this context allows you to measure your performance against industry benchmarks.
What Counts as a Low or High Conversion Rate
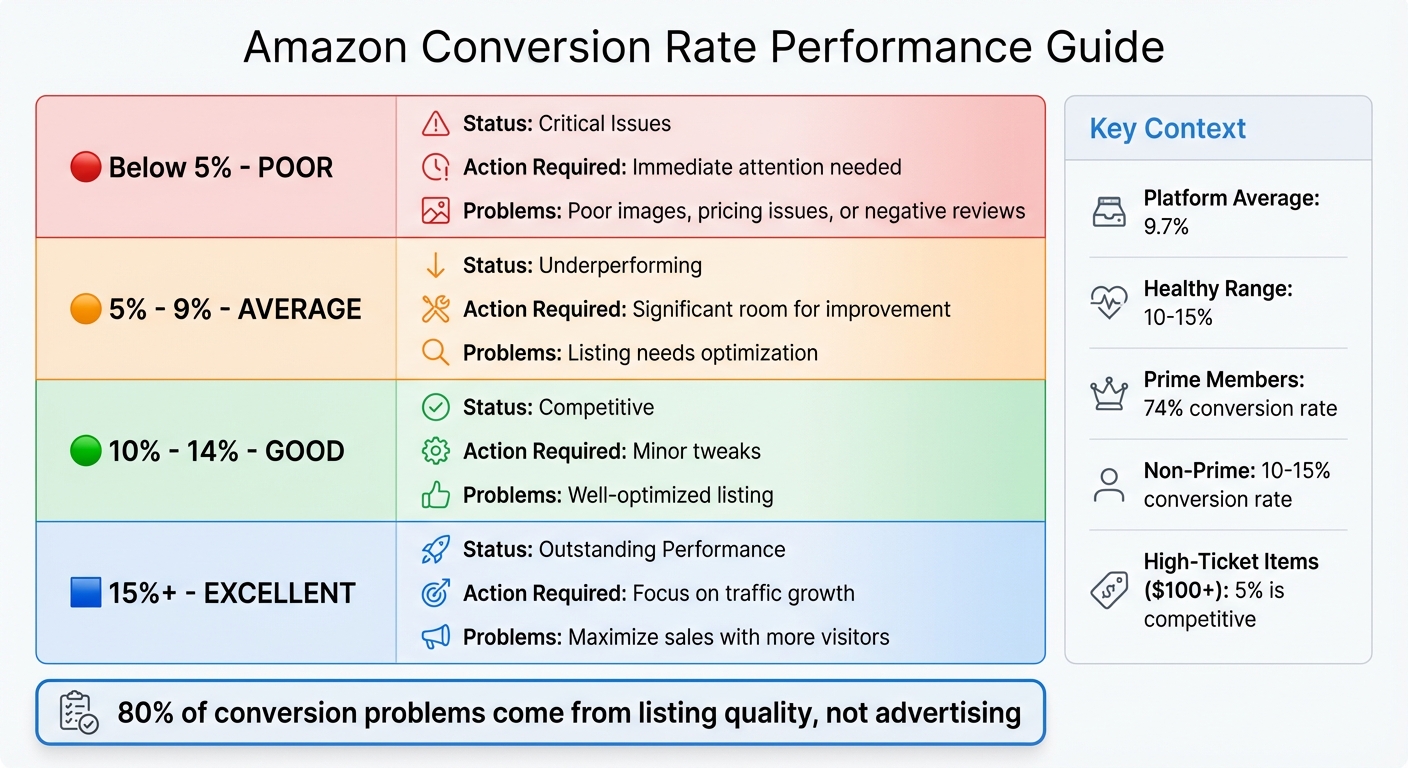
Here’s a quick breakdown of how to evaluate your conversion rate:
| Conversion Rate | Performance Level | What It Means |
|---|---|---|
| Below 5% | Poor | Critical issues with your listing – like poor images, pricing, or reviews – need immediate attention. |
| 5% – 9% | Average | Your listing is underperforming and has room for improvement. |
| 10% – 14% | Good | A solid, competitive listing that’s been well-optimized. |
| 15% and above | Excellent | Outstanding performance – focus on driving more traffic to maximize sales. |
It’s also worth noting that Amazon Prime members convert at much higher rates – around 74% – compared to non-Prime shoppers, who typically convert between 10% and 15%. If your audience leans heavily toward Prime members, your conversion numbers should reflect this advantage. These benchmarks make it easier to spot areas needing improvement before diving into specific fixes.
Why 80% of Conversion Problems Come from Your Listing
If your conversion rate is lagging, chances are the issue lies with your product listing, not your advertising. Research shows that about 80% of conversion problems are tied to listing quality, while only 20% relate to traffic or ad spend.
This is crucial to understand because many sellers instinctively pour more money into ads when sales drop. But if your product images are unappealing, your bullet points are unclear, or your price doesn’t match up with competitors, more traffic will only mean more people leaving your page without buying.
"A high ad spend won’t save a weak listing. Which is why Amazon conversion rate optimization should always be discussed prior to investing more dollars into ad campaigns."
- Brij Purohit, Co-Founder, SellerApp
Here’s an example: if 1,000 people visit your listing and only 40 make a purchase (a 4% conversion rate), doubling your ad spend to bring in another 1,000 visitors will likely result in just 40 additional sales. But if you optimize your listing and raise the conversion rate to 12%, those same 1,000 visitors could generate 120 sales instead. Even small improvements in your conversion rate can lead to massive gains – a 1% increase could mean a 10% boost in total sales.
The upside? Listing issues are entirely within your control to fix. In the next section, we’ll dive into actionable steps to address these problems.
sbb-itb-e2944f4
How to Fix Listing Problems That Kill Conversions
If your listings aren’t converting, don’t worry – these issues are within your control. Focus on three critical areas to drive those "Add to Cart" clicks.
Upgrading Your Product Images
Your images need to do more than just show your product – they should sell it. Aim for 4–7 high-quality images, including:
- One on a pure white background, with the product filling at least 85% of the frame.
- A real-life context shot to show the product in use.
- A detailed image highlighting size or fit.
For the best results, use images that are at least 1,000 pixels wide (1,600 pixels or more is even better) to enable the zoom feature. Add close-ups, infographics, and lifestyle shots to emphasize key features.
Take Jungle Creations, for example. They boosted their Best Seller Rank by optimizing their image slots with detailed graphics and automated review requests. Not sure which main image works best? Use Amazon’s "Manage Your Experiments" tool to run A/B tests and find the version that drives more clicks and sales.
Once your images are sorted, it’s time to refine your product descriptions.
Writing Better Product Titles and Bullet Points
Your product title is one of the first things a shopper notices. Make it count. As of January 21, 2025, Amazon recommends keeping titles under 200 characters, avoiding special characters, and minimizing word repetition. Start with your brand name and main keywords, then include details like quantity, size, key features, and target audience.
For bullet points, use all five slots to answer customer questions. Structure each point to highlight the primary benefit first, followed by supporting technical details. Keep them concise – between 150 and 250 characters – so they’re easy to read. Avoid vague claims like "high quality material." Instead, be specific: "Made with durable material that resists daily wear and maintains its shape".
Incorporating targeted keywords and specific use cases into your titles and bullet points can also improve your rankings. Additionally, use Amazon’s "Customer Review Insights" tool to identify recurring complaints, like "runs smaller than expected", and address those concerns directly in your copy.
If your pricing is still holding you back, it might be time to test a new approach.
Testing Your Price to Find the Right Number
Even with great visuals and copy, pricing can make or break conversions. If sales are lagging, consider experimenting with your pricing strategy. Try a 5%–10% price reduction for one to two weeks, and use the Amazon Revenue Calculator to ensure you’re still covering fees. You could also run Lightning Deals or offer digital coupons to attract more buyers.
Keep an eye on your Pricing Health dashboard and use Amazon’s "Automate Pricing" tool to stay competitive – this can help you maintain a price that’s 5% below the Featured Offer if necessary.
"Price your products too high and customers won’t buy them. Price them too low and you may not turn a profit."
- Mickey Toogood, Sr. Content Marketing Manager, Amazon
Even small adjustments can make a big difference. For instance, a 1% price increase can significantly boost your overall profits.
When and How to Increase Your Ad Spending
Once your listing is fully optimized, it’s time to take things up a notch with advertising. But don’t just throw money at ads – let the data guide every dollar you spend.
Start by checking your Advertising Cost of Sales (ACoS). If it’s below your target, that’s your signal to scale up. As Advigator points out, "If the ACoS is lower than your target, it makes sense to increase the bid to receive more traffic". Also, keep an eye on Amazon’s "out-of-budget" notifications so you’re not caught off guard by early budget depletion.
Before increasing your ad spend, take a moment to ensure your listing is ready. The Search Query Performance report is a great tool for this. Compare your Click-Through Rate (CTR) and Conversion Rate (CR) to market averages. If your numbers are better than the benchmarks, your listing is ready to handle extra traffic without wasting money.
Focusing on Keywords That Drive Sales
Once your ad budget is dialed in, shift your focus to the keywords that are actually driving sales. Your Search Term Report is your best friend here – it shows which phrases are turning clicks into revenue. Long-tail keywords like "waterproof marathon training shoes" often outperform broader terms like "running shoes" because they convert better and usually have a lower ACoS.
Take the top-performing keywords and move them into dedicated Manual Exact match campaigns. Follow the 80/20 rule: focus on the small group of keywords that generate the majority of your sales. For maximum control, limit these campaigns to five keywords each.
Give your campaigns some time to settle – about 7 to 30 days – before making any budget adjustments. This waiting period helps you identify real trends instead of reacting to short-term fluctuations. Keep in mind that Amazon’s average Cost-Per-Click (CPC) rose from under $0.95 in Q4 2024 to over $1.10 by May 2025, so factor that into your strategy.
Implementing Negative Keywords to Eliminate Waste
After zeroing in on high-performing keywords, it’s time to cut the fat. Negative keywords are a powerful way to eliminate wasteful spending. They prevent your ads from showing up for irrelevant searches, letting you redirect your budget toward traffic that’s more likely to convert.
Start by downloading your Search Term Report and look for terms that have racked up seven or more clicks without generating any orders. Add these as Negative Exact matches to stop the drain immediately.
For broader categories of irrelevant queries – like searches including "free", "cheap", "used," or "refurbished" – Negative Phrase match can block entire groups of unwanted searches at once. Carla Bauto Deña from AMZ Advisers highlights the importance of this approach:
"Your search term report is one of the most honest tools in your Amazon strategy stack. It doesn’t rely on assumptions or algorithms. It gives you direct access to how shoppers are finding your products, in their own words"
Review your search term data weekly or bi-weekly to catch any new trends before they start eating into your budget. However, be cautious about blocking common misspellings of your main keywords – these often convert almost as well as the correctly spelled terms. With 62% of advertisers planning to expand their use of negative keywords, this tactic is quickly becoming a must for serious sellers.
Conclusion
The Detail Page Sales and Traffic by ASIN report helps uncover why some products attract clicks but fail to convert into purchases. By analyzing the Unit Session Percentage, sellers can pinpoint which products are performing well and which ones need attention.
As Alex Borisenko-Markovich aptly put it, "The most successful Amazon sellers operate like scientists, not gamblers", emphasizing the importance of using data-driven strategies. Instead of pouring more money into ads for underperforming listings, the focus should be on improving those listings first. Optimized content has a proven impact on boosting sales and increasing first-year revenue.
A key takeaway here is the "fix before funding" principle. Increasing ad spend on listings that aren’t converting well often leads to wasted resources. Instead, leverage the report to rank your ASINs by Unit Session Percentage in descending order. This allows you to quickly identify underperforming products and make the necessary improvements.
Once your listings are optimized and showing better conversion rates, it’s time to think about scaling your advertising. Focus on high-conversion, low-traffic products as ideal candidates for additional ad investment. This ensures that every dollar spent on marketing is working toward meaningful and sustainable growth.
FAQs
How can I use the Detail Page Sales and Traffic Report to increase my Amazon conversion rate?
The Detail Page Sales and Traffic Report in Amazon Seller Central is a powerful tool for understanding how your product listings are performing. It breaks down key metrics like page views, units ordered, and conversion rates for each ASIN within a specific time frame. To access it, navigate to Reports → Business Reports → Detail Page Sales and Traffic by ASIN. Once there, export the data to a spreadsheet for easier analysis.
Pay close attention to ASINs that attract a lot of traffic but show low conversion rates. This often points to issues with the listing itself. Start by refining the product title, bullet points, and images to better showcase the product’s strengths. Including a video can also make the listing more engaging. If pricing seems to be a barrier, consider testing a small price adjustment or offering a limited-time coupon to see how it affects sales. Another crucial step is reviewing customer feedback to uncover and address recurring complaints. Use the report’s data to prioritize your updates, and then monitor conversion rates to measure the impact of your changes.
Regularly reviewing this report and making data-driven improvements can help you fine-tune your listings and boost your sales over time.
What are the main reasons my Amazon product listing isn’t converting?
Several factors can influence the conversion rate of your Amazon product listing. These typically fall into three main categories: listing quality, pricing, and operational issues.
- Listing quality: If your product page doesn’t clearly convey its value, shoppers are likely to move on. Common culprits include unclear or overly complex titles, poor-quality images, incomplete or vague descriptions, and missing enhanced content like A+ pages. Additionally, a lack of positive reviews or unanswered customer questions can erode trust, discouraging potential buyers.
- Pricing: Even the best listings can falter if the price isn’t competitive. High prices or unexpected fees can drive customers away. On top of that, oversized packaging that increases FBA fees may force you to raise your price, making your product less attractive.
- Operational issues: Issues such as out-of-stock products, listing errors that block the Buy Box, or a high rate of returns can severely impact your conversions. Maintaining consistent inventory, resolving listing problems quickly, and keeping an eye on return rates are all essential for keeping your performance on track.
How do I know when to increase my Amazon ad budget?
When data shows that boosting your Amazon ad budget can drive more profitable sales without eating into your margins, it’s time to act. Begin by checking your Advertising Reports on a weekly basis. If your Advertising Cost of Sale (ACoS) is well below your target (say, under 15%) or your Return on Ad Spend (ROAS) looks solid, it’s a clear sign that your campaigns are running efficiently and could benefit from additional investment.
Next, dive into Brand Analytics, focusing on the Search Query Performance and Top Search Terms dashboards. Spotting high-converting keywords with limited impressions? That’s an opportunity. Allocating more budget to Sponsored Products or Sponsored Brands targeting these keywords can help you capture more traffic from terms that are already proving their worth.
Lastly, take a close look at your Business Reports. If your unit-session percentage (conversion rate) is strong – let’s say above 10% – but your session volume is low, it’s a sign your listing resonates with shoppers but lacks visibility. In this case, increasing your ad budget can help amplify exposure and bring in more traffic.
By keeping an eye on these critical metrics, you can make informed decisions to scale your ad spend, driving sales while maintaining healthy margins.