
Analyzing competitor market share is critical for understanding your position in the industry and crafting effective strategies. It helps you identify how much of the market your business controls compared to others, where competitors excel, and where you can improve. Here’s a quick summary:
- What It Is: Market share analysis measures the percentage of total sales your business captures in a specific market.
- Why It Matters: It reveals gaps in your strategy, highlights opportunities, and helps you stay competitive by tracking performance across metrics like clicks, sales, and customer behavior.
- How to Do It: Use tools like Semrush, Similarweb, or Jungle Scout to collect data on traffic, sales, and customer actions. Then, calculate metrics such as revenue share, unit share, and relative market share (RMS).
- Key Insights: Compare your performance with competitors to find areas for improvement, such as SEO, pricing, or product presentation.
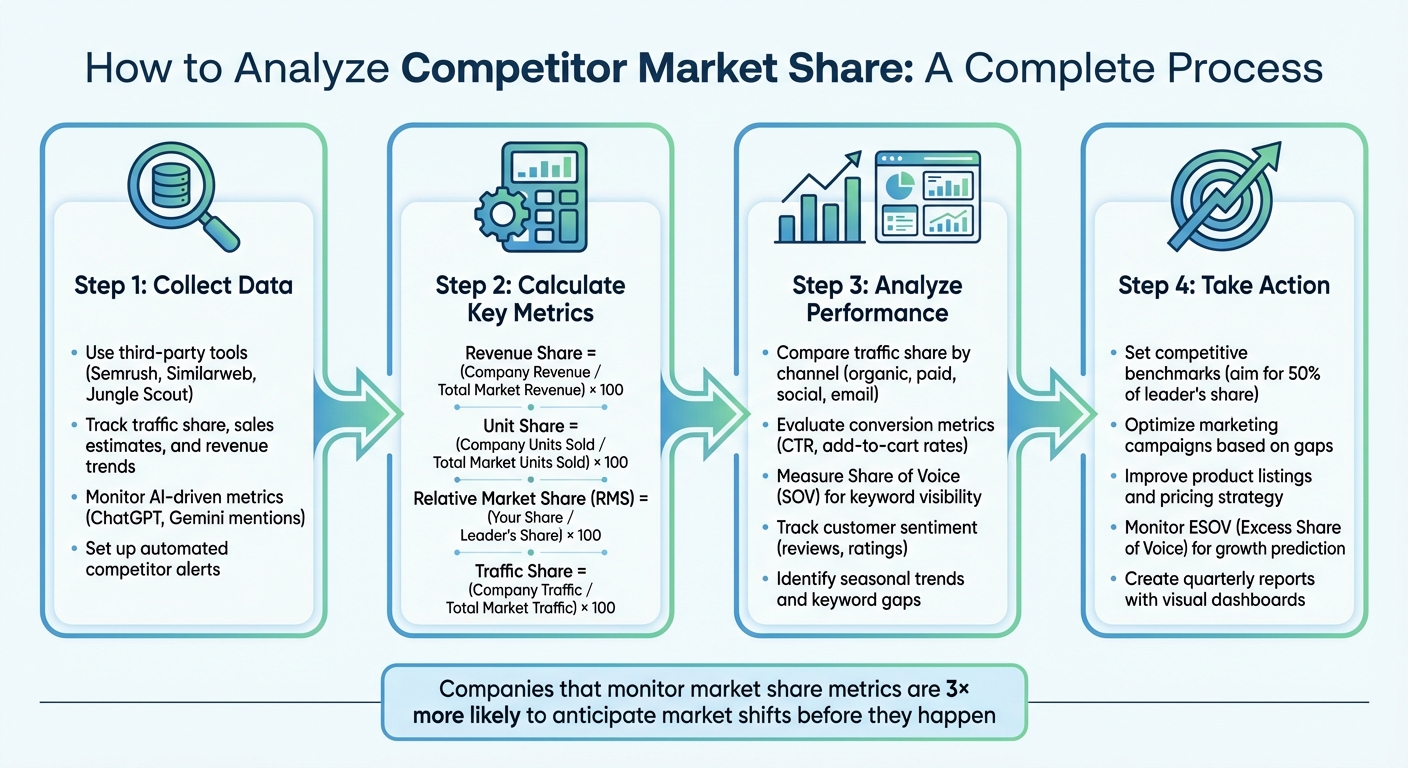
How to Analyze Competitor Market Share: 4-Step Process
How to do a market & competitor analyses
sbb-itb-e2944f4
Collecting Competitor Market Share Data
Start by using reliable third-party tools that analyze real user behavior. Platforms like Semrush and Similarweb leverage clickstream data from millions of users to provide insights. For instance, Semrush processes data from over 200 million internet users to offer traffic and market intelligence estimates. These tools give you performance metrics without requiring access to competitors’ private information.
If you’re targeting Amazon-specific data, tools like Jungle Scout can be incredibly useful. Jungle Scout monitors over 600 million products across 24 categories. In August 2024 alone, Amazon.com saw approximately 1.6 billion products sold, marking an 8% increase compared to the previous year. These tools can provide key insights, such as sales estimates, revenue trends, and unit sales at both the brand and category levels. This allows you to gauge which brands are thriving on the platform and the scale of their success.
Finding Reliable Data Sources
Traffic analytics tools are a great starting point, as they measure "traffic share" – the percentage of total industry visits a specific site receives. This metric can act as a stand-in for market share when actual revenue figures aren’t publicly accessible. If your competitors are publicly traded, their financial reports are an excellent primary source for revenue data, which can then be used to calculate revenue market share.
Additionally, many modern tools now track AI-driven metrics, such as how AI assistants like ChatGPT, Gemini, or Claude mention and recommend competitor brands. This is becoming increasingly important as AI-driven discovery grows alongside traditional search engine activity. These tools also offer detailed regional reporting, helping you identify opportunities at the state or country level. With these advanced data sources, you can estimate market share more accurately, which is essential for setting benchmarks and refining your strategies.
Gathering Website Traffic and Sales Metrics
When revenue data isn’t available, you can estimate a company’s online presence using the formula:
(Company Website Traffic / Total Market Traffic) × 100.
For eCommerce businesses, make sure you analyze both web and mobile app data, as digital engagement often spans multiple channels. Pay attention to share of wallet, which measures the percentage of a consumer’s spending in a specific category that goes to your brand versus competitors. Also, look at cross-shopping behavior – this reveals which other brands your customers visit on the same day, giving you a clear picture of your direct competition.
To stay ahead, set up automated alerts to track competitor activity. These alerts can notify you in real time when competitors launch new pages, adjust pricing, or experience traffic surges. This allows you to respond quickly and adjust your strategies as needed.
Analyzing Competitor Market Share Data
Measuring Competitor Performance Metrics
Once you’ve gathered reliable data, the next step is to measure key performance metrics. Start by calculating revenue and unit market shares to differentiate financial strength from sales volume. The formulas are straightforward:
- Revenue Share = (Company Revenue / Total Market Revenue) × 100
- Unit Share = (Company Units Sold / Total Market Units Sold) × 100
These metrics often reveal surprising insights. For instance, a competitor might sell fewer units but dominate revenue due to higher pricing – or the opposite could be true.
To get a sharper perspective, calculate Relative Market Share (RMS). Divide your market share by that of the leading competitor, then multiply by 100. An RMS above 100% signals market leadership, while an RMS near 50% means your revenue is half that of the top player. This measure gives a clearer picture of competitive standing than raw market share alone.
Dig deeper by examining traffic share by channel. Break down where competitors attract visitors – whether through organic search, paid ads, direct traffic, social media, referrals, email, or display ads. For example, if a competitor thrives in organic search but struggles with social media, you might find an opportunity to strengthen your presence in underutilized channels.
Next, focus on conversion metrics to understand how effectively competitors turn interest into sales. Track metrics like impressions, click-through rates (CTR), add-to-cart rates, and final conversion rates. For instance, if a competitor has high traffic but low add-to-cart rates, their product presentation might be lacking – giving you a chance to outshine them with better listings or optimized pages.
Evaluate Share of Voice (SOV) to assess keyword visibility across organic and paid search results. High SOV for non-branded keywords (like “gaming chair”) reflects strong SEO performance and broad reach, while dominance in branded searches points to customer loyalty. Pair this with customer sentiment metrics – such as review counts, average ratings, and trends – to pinpoint areas where competitors are excelling or falling short.
These metrics provide a solid foundation for identifying market trends and uncovering untapped opportunities.
Identifying Market Trends and Gaps
Once you’ve analyzed performance metrics, use this information to spot trends and gaps in the market. Start by examining seasonal fluctuations in competitor data. Many industries experience predictable cycles – golf equipment often peaks in spring and summer, while gaming chairs see a surge in fall before the holidays. For example, in August 2024, the gaming chair market on Amazon brought in $326.7 million, marking a 14.1% year-over-year increase. However, conversion rates dropped despite growing views, hinting at a potential gap. This could indicate pricing concerns or a lack of trust in product quality, leaving room for improvement.
Conduct a keyword gap analysis to uncover opportunities competitors might be overlooking. Use tools to identify "weak" keywords – those with high search volume but low difficulty where competitors currently outrank you. These are prime targets for reclaiming traffic through focused content or advertising strategies.
"Market share analysis goes beyond simply identifying competitors – it reveals who’s winning, why they’re winning, and most importantly, how you can capture their customers strategically." – RivalSense
Explore share of wallet to identify product line gaps. This metric shows how much of a customer’s spending within a category goes to specific brands. For instance, if gaming chair buyers are also purchasing desks from a competitor, it might signal an opportunity to expand your product offerings. Similarly, tracking cross-shopping behavior – the other brands your customers visit in the same shopping session – can highlight both direct competitors and potential partners.
Finally, look for demographic pivot opportunities. A great example comes from Stanley, which grew its revenue from $70 million in 2019 to $750 million in 2023 by repositioning its "Stanley Quencher" product. Originally marketed to construction workers and outdoor enthusiasts, the brand shifted to target a female audience, unlocking a previously untapped market. This kind of strategic pivot can reveal growth opportunities your competitors might be missing entirely.
Visualizing and Reporting Market Share Insights
Once you’ve analyzed competitor metrics, turning that data into clear visuals and structured reports can guide smarter decision-making.
Choosing the Right Visualization Tools
Raw data alone doesn’t lead to insights – it’s the way you present it that makes it actionable. The right visual format can turn a static report into a powerful tool for decision-making.
Different charts serve different purposes:
- Pie charts: Great for showing how market share is divided among competitors.
- Bar charts: Ideal for comparing performance across time periods or product categories.
- Line charts: Best for tracking trends, like seasonal changes or growth patterns.
- Bubble charts: Useful for more complex analyses, allowing you to represent three dimensions, such as market share, growth rate, and profitability.
Be cautious with your visuals. Avoid 3D charts – they can distort proportions and confuse the audience. Always start your axes at zero and stick to clean, uncluttered designs. Misleading visuals can undermine trust and lead to poor decisions.
When it comes to selecting tools, align them with your team’s needs and existing systems. For example:
- Tableau: Handles large datasets and creates interactive dashboards that are perfect for executive presentations.
- Microsoft Power BI: Works seamlessly with Excel and Azure, making it a strong choice for organizations already using Microsoft tools.
- Looker Studio (formerly Google Data Studio): A free, user-friendly option, especially for teams managing Google Ads or Analytics.
Interestingly, 77% of businesses report better decision-making when they rely on visual insights rather than raw data.
Heatmaps are another effective tool, especially for identifying geographic disparities in market share. They can show where competitors dominate or where untapped opportunities might exist. For digital markets, platforms like Semrush Market Explorer categorize competitors into groups such as Leaders and Niche Players using "Growth Quadrants".
These visualization techniques lay the foundation for creating reports that can directly influence strategic planning.
Creating Market Share Reports
Good visuals are just the beginning. Transforming those insights into structured reports ensures they lead to actionable strategies.
Start your report with an executive summary. This section should spotlight three to five key actions, giving busy leaders a quick understanding of the most critical takeaways. Follow this with dashboards that showcase visual trends, decomposition views to explain changes (like price, volume, or mix shifts), and leading indicator panels tracking metrics like Share of Voice and Share of Search.
"Market share is the scoreboard of competitive performance." – Umbrex
Break down market share changes into specific drivers. For example, is growth coming from higher prices (premiumization), increased sales volume, or customers choosing more profitable products? Understanding these dynamics can guide targeted actions.
Leading indicators like Share of Voice and Share of Search are particularly valuable. They can signal shifts in the market before they show up in sales data. Companies that monitor these metrics are three times more likely to anticipate changes ahead of time.
Quantify challenges too. For instance, if stock-outs are causing a loss in market share, or if your price is 20% higher than private labels, these insights can highlight areas that need operational adjustments.
Finally, keep your reports updated – monthly or quarterly works best. Use visual cues to emphasize critical data points, like sudden changes in market share. Always provide context for these shifts, such as product launches, competitor exits, or promotional efforts, so stakeholders understand the "why" behind the numbers.
Using Market Share Analysis for Business Growth
Market share data isn’t just about numbers; it’s a tool to fuel business growth when paired with smart strategies. By turning insights into action, businesses can carve out a stronger position in their industries.
Setting Competitive Benchmarks
Start by figuring out where your business stands compared to competitors. A key metric to use here is Relative Market Share (RMS), which you calculate by dividing your market share by the leader’s and multiplying by 100. This helps you see if you’re thriving or just hanging on.
A good goal is the "Half-Leader" benchmark – aim to hold at least 50% of the market leader’s share. Keep in mind, these figures vary by industry. For instance, in ecommerce, tech leaders typically hold 15% to 40% of the market, while major retailers sit between 10% and 25%. To put it into perspective, Amazon commands about 40% of the US ecommerce market, with Walmart at 10% and eBay at 6%.
Benchmarking also applies to your sales funnel. Compare your performance at every stage – impressions, clicks, add-to-cart rates, and purchases – against competitors. If your add-to-cart rate lags behind, that’s a clear area to improve. Another tool, Share of Search (tracking branded search volume), can act as an early warning system, often signaling shifts in market share months before they show up in sales data.
Break down your growth into specific drivers: Are you gaining from higher prices, selling more units, or shifting customer preferences within your product lineup? Understanding this helps you set precise goals. For example, if your prices are 20% higher than private-label products or the market median, that price gap could be limiting your growth.
With these benchmarks in place, you can focus your strategies on closing gaps and improving where it matters most.
Improving Marketing and Operations
Once benchmarks are set, it’s time to refine your marketing and operations using market share insights. Start by identifying keyword gaps – search terms your competitors rank for that you don’t. Add these keywords to your campaigns and increase bids on underperforming ones where you’re being outranked.
Take a close look at the buyer journey. Improve product images, optimize titles, and ensure Prime eligibility to boost click-through rates. If customers aren’t adding items to their carts, adjust your product descriptions to emphasize unique benefits and include lifestyle images that resonate with your audience.
Inventory management is another critical area. High out-of-stock rates, especially compared to competitors, can hurt your market share. If you’re losing share while competitors hold steady, focus on stock issues before ramping up ad spend – after all, you can’t sell what isn’t available.
Keep an eye on competitor strategies, too. Analyze their ad creatives and use AI tools to scan reviews, uncovering customer pain points and opportunities to stand out. Seasonal trends also matter – if certain products sell better in specific months (like golf gear in spring and summer), align your inventory and ad spend to match.
"For executives, market share is the scoreboard of competitive performance." – Umbrex
Finally, track your Excess Share of Voice (ESOV), which measures the gap between your Share of Voice and actual market share. A positive ESOV often predicts future market share growth. Businesses that consistently monitor these metrics are three times more likely to anticipate market shifts before they happen.
Conclusion
Market share analysis isn’t just about numbers – it’s about understanding your competitive standing and using that knowledge to sharpen your strategy. By gathering accurate data, evaluating competitor performance, and leveraging dashboards to visualize insights, you gain a clear view of where you excel and where you fall short. This clarity helps pinpoint strengths and weaknesses across products, channels, and customer interactions, laying the groundwork for meaningful action.
The real power lies in turning these insights into action. Whether it’s identifying keyword gaps, refining your sales funnel, or aligning pricing with market benchmarks, decisions rooted in data are far more effective than those based on assumptions. As Monique Ellis from Similarweb aptly states:
"You can’t be competitive if you don’t know what you’re competing against".
Tracking market trends consistently gives businesses an edge, offering early warnings about shifts in the competitive landscape.
For instance, analyzing metrics alongside industry leaders like Amazon can help shape growth strategies tailored to your position. Whether you’re up against industry giants or carving out a niche, understanding your market position helps set realistic goals. Insights like the distinction between value share and volume share can reveal whether growth stems from premium pricing or increased demand – key factors for shaping long-term plans.
Market share analysis should never be a one-off exercise. Make it a regular part of your business strategy by combining ongoing evaluations with the data collection and visualization methods discussed earlier. Quarterly reviews or assessments following major market shifts allow you to stay agile and responsive to customer needs. Use dashboards and reports to monitor these changes in real time, especially as the global ecommerce analytics market is projected to hit $80.48 billion by 2032, making advanced tools more accessible than ever.
Ultimately, market share reveals whether your marketing efforts resonate, your pricing remains competitive, and your product listings convert interest into sales. Use these insights to fine-tune your strategies, address weak points, and secure a stronger foothold in your market.
FAQs
How accurate are traffic-based market share estimates?
Traffic-based market share estimates serve as a helpful guide rather than an exact measurement. These estimates are built on sampling, modeling, and indirect metrics, which means their accuracy can shift depending on factors like the size of the website, fluctuations in traffic sources, and the transparency of data. Smaller websites, in particular, might experience less reliable estimates due to limited data. While these insights can highlight trends and inform strategic decisions, they work best when combined with other data sources to create a more comprehensive analysis.
Which market share metric should I track first?
The Best Sellers Rank (BSR) is one of the most important market share metrics to keep an eye on. It provides a snapshot of how a product stacks up against competitors on Amazon. This makes it a great starting point for analyzing the competition. Pair it with other crucial metrics like customer reviews, pricing trends, and advertising activity to get a fuller picture. Keeping tabs on these factors helps you gauge market positioning and spot areas where growth might be possible.
How often should I refresh my market share dashboard?
Keeping your market share dashboard updated is key to staying informed and making timely decisions. For most businesses, updating it daily or weekly works well, depending on how often decisions need to be made. If you’re running active campaigns or operating in a fast-changing market, you might need to update it even more frequently. The key is to pick a schedule that fits your business goals and the pace of your market to maintain a competitive edge.