
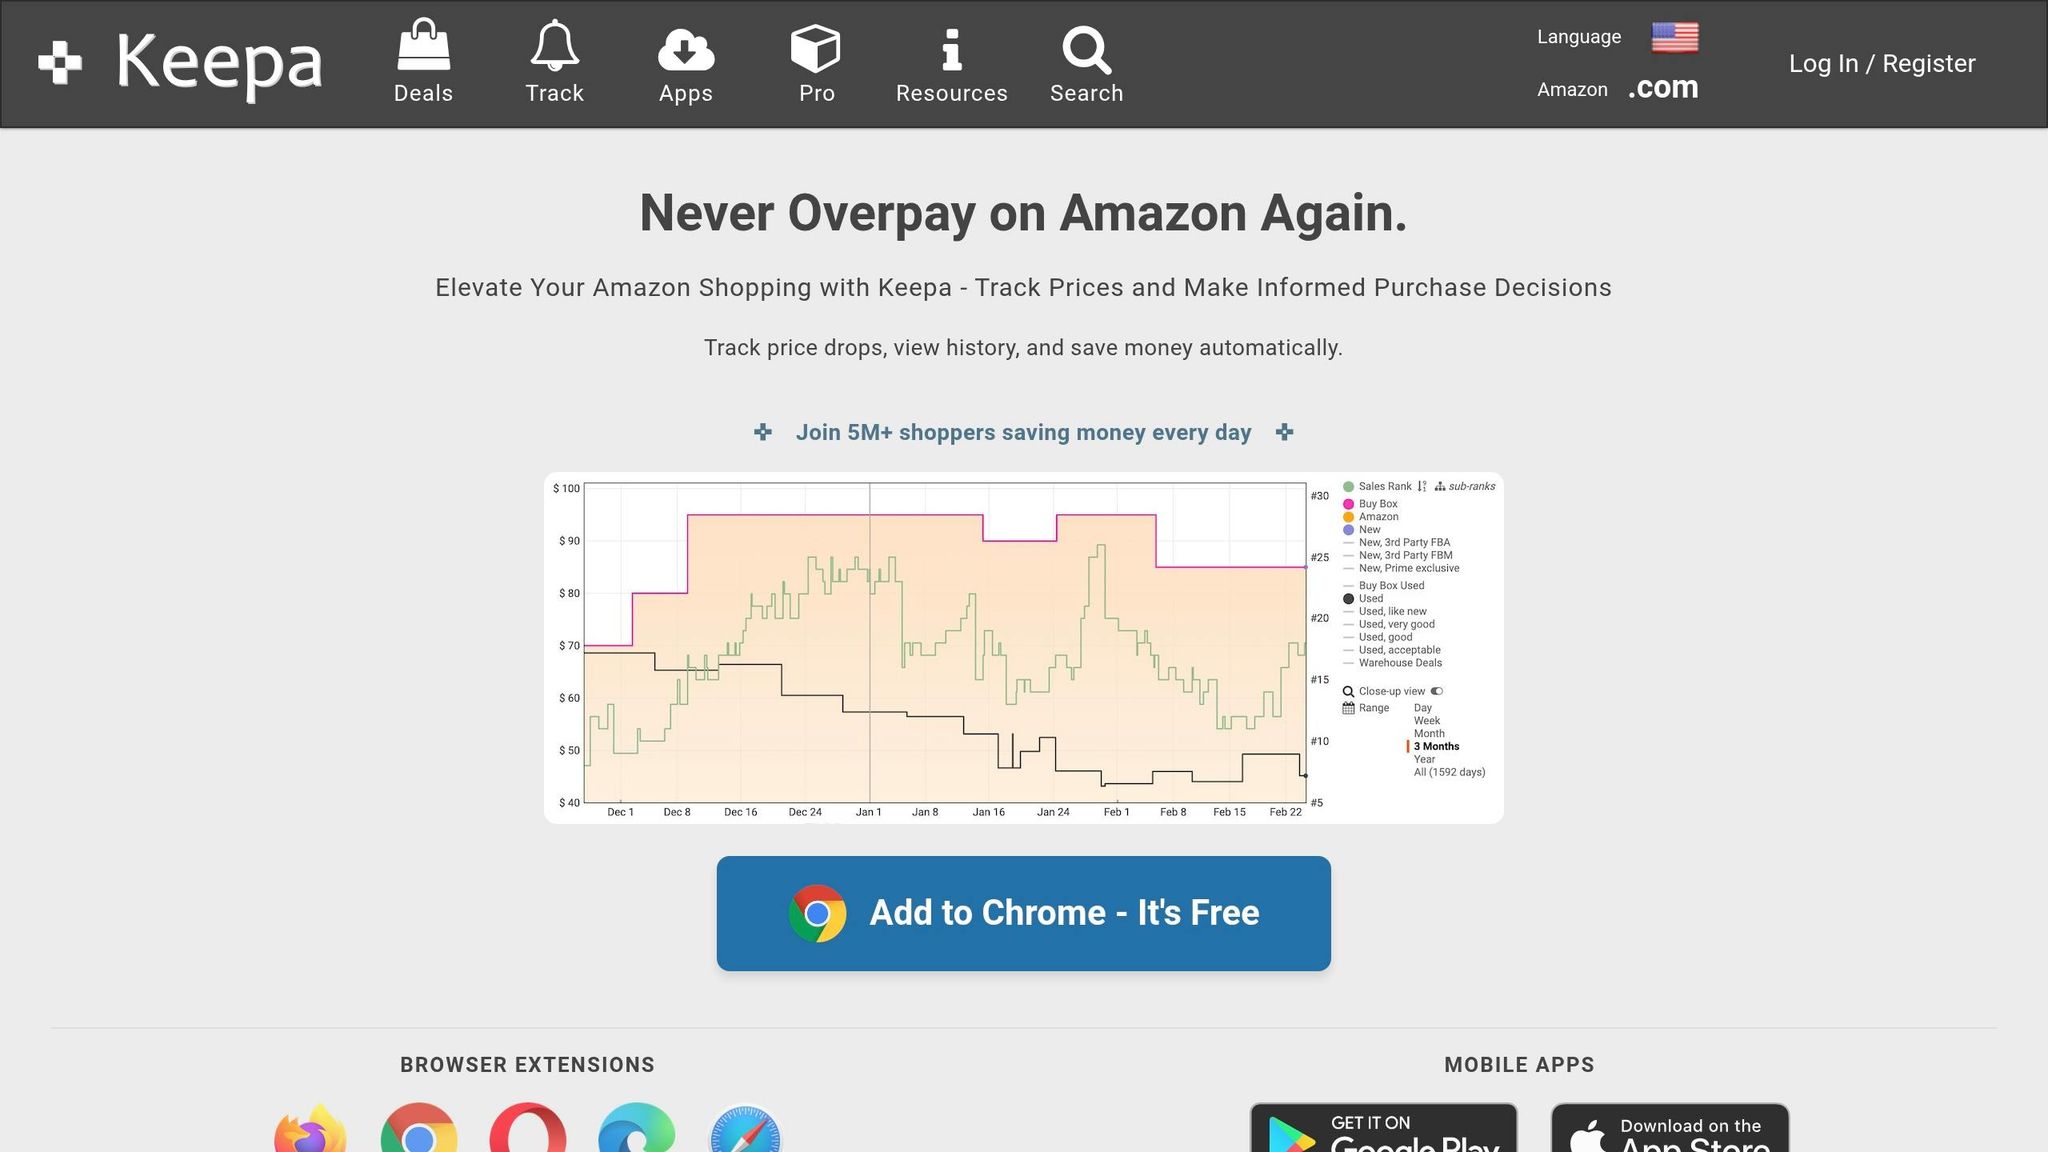
Keepa is a powerful tool for Amazon sellers, offering detailed insights into price trends, sales rank behavior, and Buy Box dynamics across over 5 billion products. It provides up to 365 days of historical data and updates as frequently as every hour for high-demand items. Sellers can use this data to identify market trends, track competitor strategies, and make smarter pricing decisions. Key features include:
- Price History Tracking: Understand historical price trends and detect artificial price inflation or stockout opportunities.
- Sales Rank Monitoring: Analyze demand patterns and seasonal trends through sales rank data.
- Buy Box Analysis: Track who controls the Buy Box, which accounts for 80% of Amazon sales, and identify competitive pricing strategies.
- Data Integration: Use Keepa’s API or no-code tools to automate data collection and integrate insights into platforms like Google Sheets or Power BI.
How To Use Keepa For Amazon FBA Full Tutorial (2026) | Step-By-Step Full Guide For Beginners
sbb-itb-e2944f4
Keepa’s Core Reporting Features
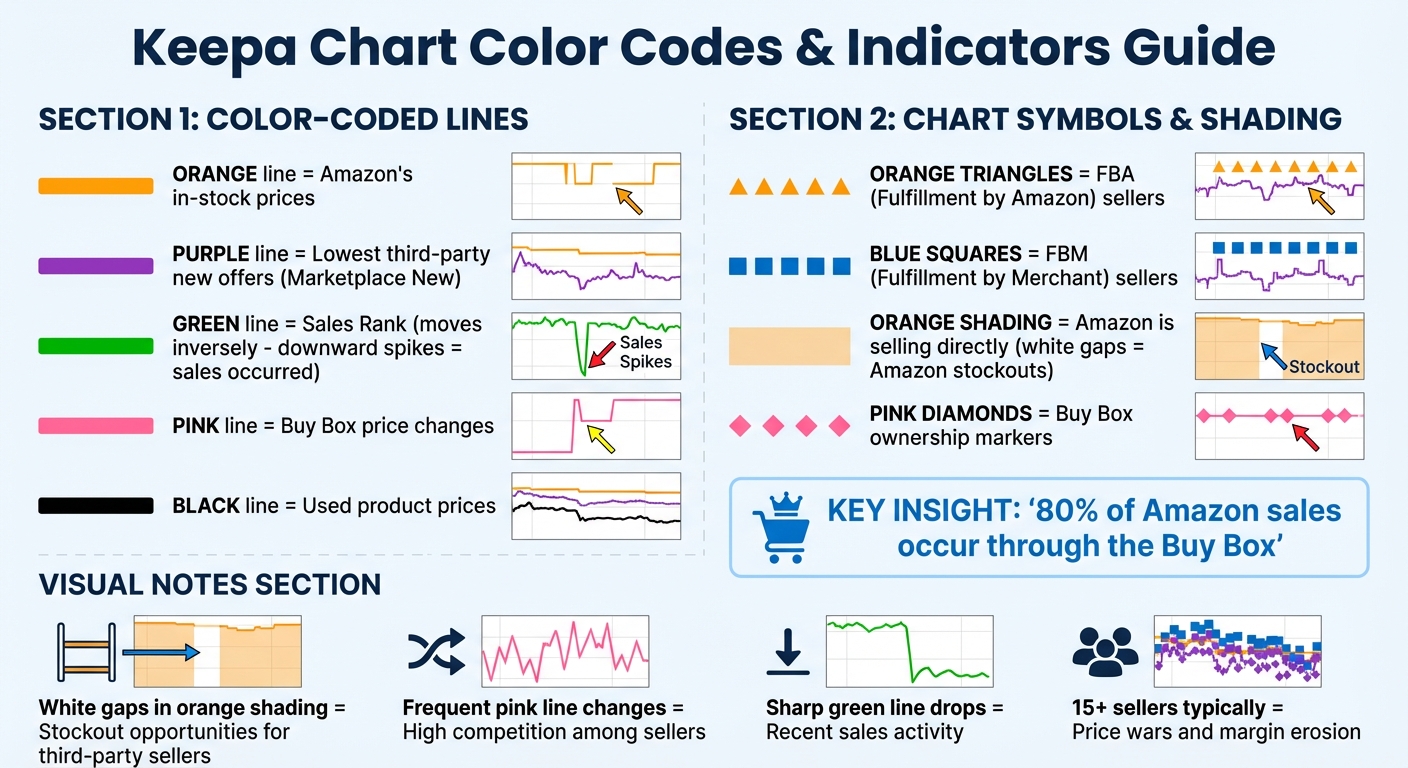
Keepa Chart Color Codes and Indicators Guide for Amazon Sellers
Keepa offers a detailed look into pricing trends, going beyond just a single price point. It tracks Amazon’s own pricing, third-party offers, and Buy Box rates, creating a layered view of the marketplace.
The platform uses color coding to make complex data easier to interpret: orange for Amazon’s in-stock prices, purple for the lowest third-party new offers, green for Sales Rank, pink for Buy Box changes, orange triangles for FBA, and blue squares for FBM. This visual approach simplifies data analysis.
Keepa also provides a year-long historical record, which is crucial for distinguishing short-term pricing anomalies from broader market trends. With tracking for over 5 billion Amazon products and Amazon updating prices up to 2.5 million times daily, having this historical context is invaluable for making informed choices.
These tools form the foundation for deeper insights into pricing trends, sales rank behavior, and Buy Box dynamics.
Price History Tracking
Keepa’s price history feature does more than show numbers – it helps uncover competitor strategies. The purple line (Marketplace New) and black line (Used) highlight historical price floors, enabling you to price competitively without sacrificing margins. Recurring patterns often reveal tactics used by competitors.
"The most common tactic is artificial price inflation before sales events… If a product shows ‘50% off’ but the Keepa chart reveals it was selling at that ‘sale’ price just two months ago, you know the discount is fake." – TaskMonkey
The charts also reveal strategic opportunities. For instance, white gaps in the orange shading indicate Amazon stockouts, which can be a chance to adjust prices and win the Buy Box. A sudden drop in the pink Buy Box line paired with a surge in New Offer Count often signals a price war. Listings with more than 15 sellers typically lead to price dumping and shrinking profit margins.
Indicators like orange triangles (FBA) and blue squares (FBM) show which fulfillment method dominates pricing battles. This helps sellers decide if the extra cost of FBA is worth the potential for higher Buy Box win rates.
Sales Rank Monitoring
Sales Rank, or BSR, acts as a proxy for demand since Amazon doesn’t share actual sales data. On Keepa’s charts, the green line moves inversely to sales: sharp downward spikes mean a sale occurred. Frequent drops suggest high sales velocity, while a steady upward trend points to slow or stagnant sales.
"Sales rank is a proxy for demand – but context is everything." – Kozan
For example, a product ranked #3 in its category is a top seller, but if the green line shows little movement, those rankings might not translate to consistent sales. On the flip side, a product with a higher average rank but regular downward spikes could be selling more units overall. Reviewing 180- to 365-day trends helps identify seasonality; summer shoes, for instance, might rank near zero in peak season but rise sharply in off-months. Long-term trends, like 90- or 180-day averages, offer a more reliable basis for projections than current rankings alone.
Understanding these patterns is key to predicting demand and adapting to market changes.
Buy Box Analysis
Keepa’s pink line and diamond markers provide a detailed view of the Buy Box price, showing how often it changes hands and who controls it. This is essential for analyzing market share.
A steady pink line suggests stable pricing and a dominant seller, while frequent fluctuations indicate fierce competition among multiple sellers. When Amazon’s orange shading overlaps with the Buy Box, it becomes much harder to compete.
"If Amazon is in the listing as a seller, it’s tough to compete with them. The internet giant has the most favorable conditions from the suppliers and can afford to offer a lower price." – Seller Assistant
If one merchant dominates the Buy Box for an extended period – like 195 consecutive days – it’s likely a Private Label product, meaning resellers won’t be able to join. This insight can save you from wasting time on non-viable opportunities. Additionally, the data reveals whether FBA sellers consistently outperform FBM sellers, helping you refine both your fulfillment strategy and pricing approach.
Setting Up Keepa Data Integration
First, you’ll need to get your API credentials. Start by registering for a Keepa account and subscribing to their monthly plan to receive your 64-character API key. This key gives you access to Keepa’s database, which includes information on over 900 million eCommerce products.
Once you have your API key, you can integrate Keepa data either through a no-code connector (like Adverity or Daton) or programmatically using Python or Java. No-code connectors make setup simple – just navigate to the "New Source" or "Connectors" menu, select Keepa, and enter your API key. If you’re using Daton, you’ll also need your Amazon Seller ID (Merchant Token), which can be found in Amazon Seller Central. For those who want more flexibility, programmatic integration with Python or Java libraries allows you to customize data retrieval and automate workflows.
After authenticating, you can configure your data streams. Define the type of report you want – whether it’s Best Sellers, Product History, or Deals – and specify the Amazon domain you want to track. Each domain has its own unique ID: for example, 1 for .com (US), 2 for .co.uk (UK), and 3 for .de (Germany). With your API key ready, you can set up real-time data connections.
Configuring API Connections
Keepa operates on a token system, where tokens are generated per minute. Typically, one token retrieves a complete dataset for a single product, and unused tokens expire after one hour. To avoid integration issues, use the check_key function to monitor token availability. If you want to speed up initialization, you can set check_key=False. For bulk data pulls, implement a wait-for-tokens logic to pause requests when your token bucket runs low – this ensures uninterrupted processing.
For live data updates, use the update parameter. Setting update=0 forces Keepa to fetch fresh data directly from Amazon, though this may use additional tokens. Keepa provides prices in the smallest currency unit (e.g., cents for USD), so divide by 100 to convert to standard dollar amounts. If you see a value of –1 in price or rank fields, it means no data is available or the product is out of stock.
Ensure that product identifiers are valid 10-character ASINs – incorrect formats will result in no data being returned. To access Buy Box data, set the buybox parameter to True, which costs 2 tokens per product. Once your connections are securely set up and token management is in place, you can refine your data streams for better insights.
Filtering Data for Relevant Insights
Raw data from Keepa can be overwhelming without proper filtering. To narrow your focus, use category node IDs. The CategoryLookup method helps you find specific Amazon category IDs. For example, using category ID 0 retrieves all top-level categories, which you can then drill down into.
Instead of relying on current sales rank, filter by 30-, 90-, or 180-day averages to smooth out temporary fluctuations. To exclude used or refurbished listings, set priceTypes to 1 (Amazon) and 2 (Marketplace New).
For advanced filtering, consider using the outOfStockPercentage90 parameter to identify competitors frequently running out of stock – this can reveal opportunities to capture market share. The deltaPercentRange filter highlights competitors making significant price cuts. To avoid skewed data from multiple variations, set variations to False or use singleVariation to return just one representative product per parent ASIN.
You can also optimize data pulls by limiting historical data to recent periods (e.g., 30 or 90 days) using the days parameter. This reduces response size and speeds up processing. If historical offer data isn’t needed, enable the only_live_offers parameter. For tools like Adverity, periodically use the "Update Categories" function to ensure Best Sellers reports reflect the latest Amazon category structure. These refined data pulls streamline reporting and help you turn historical data into actionable insights.
Interpreting Keepa Data for Market Share Reports
Once you’ve configured and filtered your Keepa data streams, the next step is to transform that raw data into actionable insights. By analyzing price trends and sales rank patterns, you can uncover shifts in market share and better understand the competitive landscape. Together, these elements provide a fuller picture of how market dynamics are evolving.
Using Price Trends to Evaluate Competitor Strategies
Price history graphs are a powerful tool for understanding competitor strategies. For example, some sellers may inflate prices artificially before major sales events. The pink Buy Box line on Keepa’s charts highlights the current winning seller; frequent changes in this line suggest intense competition among multiple sellers . If the Buy Box price drops well below its 90-day average, aggressive price undercutting could be eroding profit margins. Additionally, white gaps in the orange shading of Keepa graphs indicate Amazon stockouts, creating opportunities for third-party sellers to step in and capture more market share .
"If Amazon is in the listing as a seller, it’s tough for third-party sellers to compete. Amazon has favorable supplier conditions and is reluctant to give up the Buy Box." – OABeans
Another key indicator is the "New Offer Count." High turnover in this metric can signal seller churn, which often precedes price wars. To avoid falling into "deal traps", base your profit projections on 90-day or 180-day averages rather than short-term price peaks. This approach helps you account for sustainable margins and competitive pressures.
Sales rank data complements price trends by offering deeper insights into demand and competitive positioning.
Assessing Market Dynamics with Sales Rank Data
The green sales rank line on Keepa graphs reflects product demand. A lower rank corresponds to higher sales, while sharp drops in the rank often indicate sales events. If the sales rank moves up and down frequently, it suggests steady demand and consistent sales velocity.
On the flip side, an upward-trending sales rank may point to declining popularity or competitors gaining traction. By analyzing sales rank over 180-day or 1-year windows, you can differentiate between seasonal trends and actual market shifts. Products with consistently low ranks are "steady performers" with reliable demand, whereas abrupt rank changes often hint at seasonal fluctuations or unpredictable sales patterns.
Since roughly 80% of Amazon sales come through the Buy Box, tracking Buy Box ownership alongside sales rank offers a clear perspective on competitive positioning. For instance, if a product’s sales rank holds steady or improves while competitors’ offer counts increase, it may signal a loss of market share in real time.
| Rank Pattern | Market Interpretation |
|---|---|
| Consistently Low Rank | Indicates strong demand and high market share |
| Abrupt Changes | Points to seasonal or erratic sales patterns |
| Flatlining Rank | Suggests a low-turnover niche or suppressed demand |
| Increasing Rank Trend | Reflects declining relevance or market share loss to competitors |
Automating Insights and Alerts
Turning raw Keepa data into actionable insights can supercharge your competitive strategy, and automating alerts is the way to do it. Manually tracking prices and trends around the clock just isn’t feasible. Keepa’s automated alert system does the heavy lifting, monitoring prices 24/7 and refreshing data for popular products about every 15 minutes. This gives you the edge to spot lightning deals, identify when competitors run out of stock, and adapt quickly to market changes. In today’s fast-paced e-commerce landscape, automation is a must-have.
Creating Price Drop Alerts
Setting up price alerts in Keepa is pretty straightforward. Just click "Track product", set your target price, and pick how you want to be notified. You’ve got options:
- Email for non-urgent updates
- Browser push notifications for instant desktop alerts
- Telegram for fast mobile updates
- RSS feeds if you’re pulling data into other tools
The trick is to set realistic thresholds. Before you create an alert, check the product’s historical low price on the Keepa chart. A good rule of thumb? Set your target 5–10% above that low. You can also use percentage-based alerts – for example, tracking a 20% price drop – to catch meaningful changes without drowning in minor updates.
Price increases are just as important to monitor. They can signal competitor stockouts or opportunities for you to raise your own prices and boost margins. For businesses managing a large number of products, Keepa’s Product Viewer tool is a lifesaver. It lets you upload up to 10,000 ASINs via CSV or text file, making it easy to monitor entire categories or multiple brands at once.
Real-Time Market Monitoring
Price drop alerts are just the beginning – there’s a lot more you can automate. Keeping tabs on other key metrics like Buy Box changes, seller activity, and Amazon stockouts is crucial. Since around 80% of Amazon sales go through the Buy Box, it’s essential to know when the Buy Box price shifts or when control passes between Amazon and third-party sellers. Look for the pink line on Keepa charts – it shows who’s winning the Buy Box. Frequent changes here often signal heavy competition, which could mean it’s time to tweak your pricing strategy.
Another valuable alert is for Amazon stockouts. On Keepa graphs, these show up as white gaps in the orange shading. These gaps are golden opportunities for third-party sellers to step in and capture sales at higher prices, free from Amazon’s usual price dominance. You can also set alerts to track specific competitors – maybe a trusted merchant you keep an eye on – so you can stay focused on the players that matter most.
For those diving deeper into analytics, the Keepa API is a powerful tool. It provides programmatic access to data points like buyBoxPrice, buyBoxSellerId, and buyBoxIsFBA status. By integrating this data into your business intelligence tools, you can create automated reports that update throughout the day, turning raw alerts into actionable insights at lightning speed.
Integrating Keepa Data with Other Analytics Platforms
Integrating Keepa data with your analytics platforms can significantly improve your market share reporting. By combining Keepa’s insights with advanced analytics tools, you can create precise, automated market share reports without the hassle of manual data handling.
Rather than exporting CSV files and manually assembling reports, you can set up automated pipelines to feed Keepa’s market data directly into platforms like Tableau, Power BI, or Google Data Studio. Tools like ETL (Extract, Transform, Load) platforms – such as DataChannel or Adverity – help automate this process by moving Keepa data into centralized data warehouses like BigQuery or Snowflake. This not only saves time but ensures your dashboards stay up to date with the latest market trends.
For smaller-scale reporting, Google Apps Script provides a simpler solution. It allows you to pull Keepa API data straight into Google Sheets, which can then act as a live data source for tools like Google Data Studio or Power BI. This approach is especially useful for smaller sellers who need actionable insights without investing in enterprise-level infrastructure. The Keepa API delivers up to 22 different data points in a single "offers" object response, including seller reviews and shipping costs, offering plenty of material for analysis. For more complex needs, integrating with business intelligence tools offers even more flexibility.
Combining Keepa Data with Business Intelligence Tools
When linking Keepa data to BI platforms, it’s critical to align it with your internal metrics. For instance, Keepa’s price data is often in the smallest currency unit (like cents), so you’ll need to convert it to standard dollars for proper visualization. Similarly, Keepa operates on a unique "Keepa Time minutes" format, requiring conversion to standard timestamps for compatibility with BI tools.
Instead of connecting BI tools directly to the API, it’s better to route data through a warehouse. This setup enhances performance, avoids API rate limits, and allows for complex historical queries. Scheduling regular updates – whether daily or hourly – ensures that your dashboards in Tableau or Power BI reflect real-time changes in prices and sales ranks. Some ETL tools even support retrieving up to 10,000 ASINs via paging, making it easier to analyze large datasets.
To streamline processing and reduce costs, filter data at the source using API parameters like rootCategory or priceTypes. This helps focus on critical metrics for market share analysis, such as buyBoxPrice, salesRankDrops30/90/180, outOfStockPercentage90, and offerCountFBA. These parameters provide the competitive insights you need without overloading your system with unnecessary data.
Here’s a quick summary of integration methods and their ideal use cases:
| Integration Method | Best For | Tools Involved |
|---|---|---|
| Direct API (Custom Code) | Custom applications and bulk data collection | Python, Google Apps Script, Keepa API |
| ETL/ELT Platforms | Enterprise-level reporting and data warehousing | Adverity, DataChannel, BigQuery, Snowflake |
| Spreadsheet Connectors | Small to medium sellers and quick snapshots | Google Sheets, Excel, Apps Script |
Conclusion
Leverage Keepa data to make smarter, context-aware market decisions. By focusing on 90- and 180-day averages, you can better understand market trends while avoiding knee-jerk reactions to short-term fluctuations.
When using historical averages, keep key marketplace factors in mind. For example, the Buy Box drives around 80% of Amazon sales, so tracking its stability and win rates should be central to your strategy. Pay attention to the orange shaded area on Keepa charts – it indicates when Amazon is selling directly. Competing with Amazon often means tighter margins and fewer chances to win the Buy Box. Additionally, keep an eye on the "New Offer Count." A sudden spike could signal potential price wars or increased market saturation.
For larger-scale analysis, the Keepa API is a powerful tool. It allows you to analyze up to 10,000 products simultaneously using the Product Viewer, with data easily integrated into your BI tools. This automation ensures your dashboards stay up to date, giving you more time to focus on strategic planning.
Set real-time alerts for price changes to stay ahead of competitor moves and uncover margin opportunities. Develop a consistent analysis process for every product you monitor, including evaluating demand stability, Buy Box trends, and FBA competition. This approach ensures well-informed decisions on inventory and pricing.
FAQs
Which Keepa metrics matter most for market share reports?
Keepa offers several important metrics that can give eCommerce managers a clearer picture of market trends and competition. These include:
- Price history: Tracks how prices have changed over time, helping to identify pricing trends and fluctuations.
- Sales rank trends: Offers insights into product demand by showing how a product’s ranking shifts over time.
- Buy Box statistics: Provides data on which sellers are winning the Buy Box and under what conditions, revealing key competitive dynamics.
Together, these metrics help businesses understand demand patterns, assess pricing strategies, and evaluate their competitive standing in the marketplace.
How can I avoid API token limits when pulling lots of ASINs?
Efficiently managing your API token usage with Keepa is all about smart planning. One way to conserve tokens is by batching multiple ASINs into a single API call. This approach minimizes token consumption for each request.
Additionally, keep a close eye on your token usage. If you’re planning to pull large amounts of data, spread those requests out over time. This way, you can stay within your quota while still gathering all the information you need.
By combining batching with careful scheduling, you can maximize your data extraction efforts without worrying about hitting token limits.
What’s the best way to combine Keepa data with my BI dashboards?
To make the most of Keepa data in BI dashboards, start by loading it into a data warehouse with dependable ETL tools. This approach consolidates your data, making it easier to analyze. Once centralized, you can connect BI tools like Tableau or Power BI to create visualizations and insights.
Another option is leveraging the Keepa API. This allows you to fetch data programmatically, offering flexibility for real-time updates or scheduled data refreshes – perfect for customized reporting needs.