Want to get more out of your warehouse space? Measuring storage efficiency is the first step. It’s not just about fitting more inventory but using your space smarter to cut costs, speed up operations, and keep workers productive.
Here’s the key takeaway:
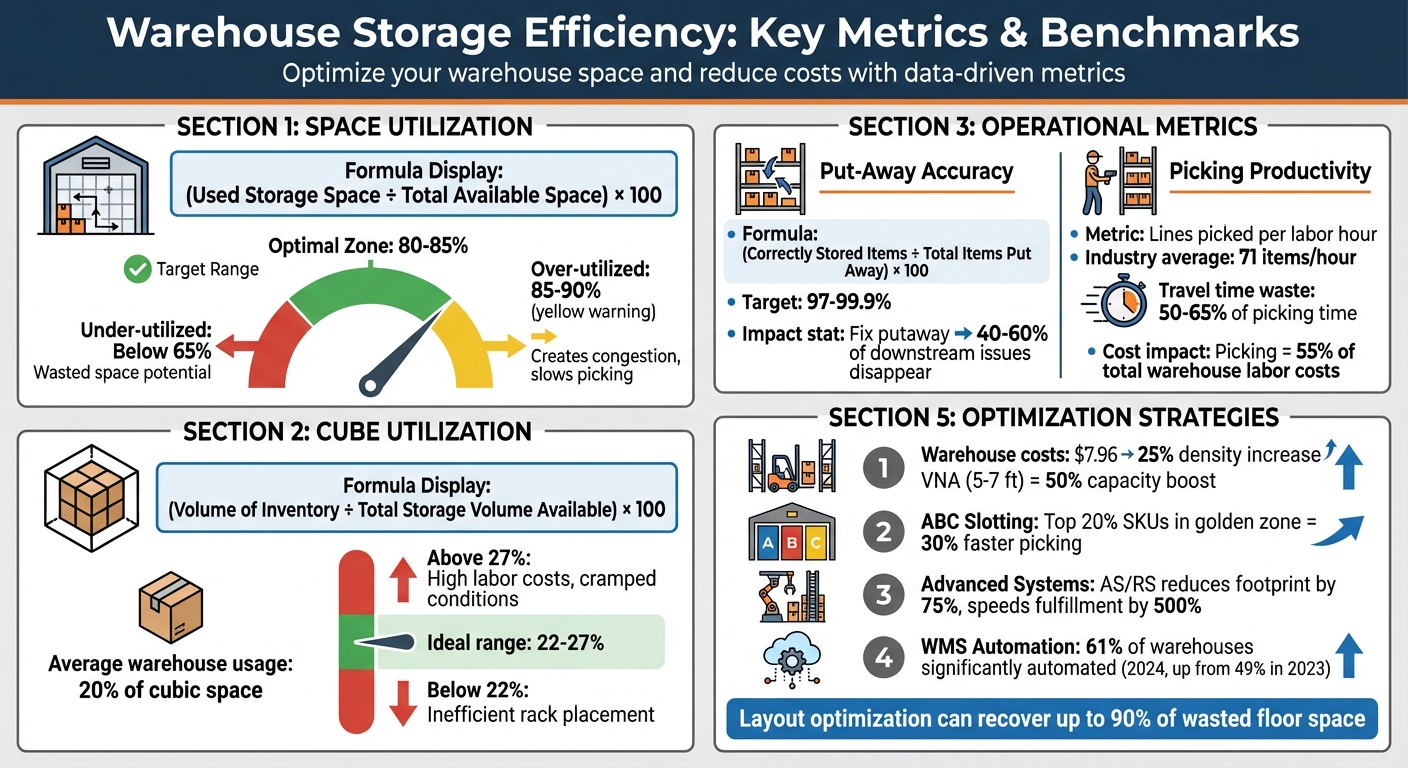
- Space Utilization: Calculate how much of your warehouse’s capacity is actively used. Aim for 80%-85%.
- Cube Utilization: Use vertical space effectively. Ideal range: 22%-27%.
- Operational Metrics: Track put-away accuracy (97%-99.9%) and picking productivity (71 items/hour).
Simple fixes like narrowing aisles, reorganizing high-demand items, and using tech like Warehouse Management Systems (WMS) can make a big difference. Even small changes can save money and delay costly expansions.
Keep reading for formulas, tools, and tips to optimize your layout and improve storage efficiency.
Warehouse Storage Efficiency Metrics and Benchmarks Guide
How to Improve Warehouse Capacity & Productivity
How to Calculate Space Utilization
Space utilization measures the percentage of your warehouse’s capacity actively used for storing inventory. The formula is straightforward: (Used Storage Space ÷ Total Available Space) × 100.
Space Utilization Rate Formula
Start by determining your total available space. To do this, subtract non-storage areas – like offices, restrooms, shipping docks, and maintenance rooms – from the warehouse’s total square footage. Then, multiply the adjusted square footage by the clear height of your facility to calculate its true cubic storage capacity.
Generally, the ideal warehouse utilization rate falls between 80% and 85%. Exceeding 85% to 90% can create congestion, slowing down picking operations and driving up labor costs. On the other hand, a rate below 65% might indicate you’re not making the most of your space. Abby Jenkins, Product Marketing Manager at NetSuite, puts it simply:
"Warehouse space utilization is a measure of how much of a warehouse facility’s available storage capacity is being used to hold inventory, goods, or equipment".
After calculating your overall utilization, dive deeper into specific zones to identify inefficiencies.
Finding Underused Areas
Once you know your utilization rate, the next step is to locate zones that aren’t working efficiently. Tools like warehouse management systems (WMS) and heat maps can help you spot empty racks, inefficient staging areas, or partially filled pallets. Breaking down utilization by specific zones – such as cold storage, bulk storage, or forward pick areas – can highlight sections that fall short of their potential benchmarks. Regular audits are also helpful for identifying slow-moving SKUs that occupy prime storage space better suited for fast-moving products.
With warehouse costs climbing from $7.96 to $8.31 per square foot between 2022 and 2024, addressing these inefficiencies isn’t just smart – it can have a noticeable impact on your bottom line.
How to Measure Inventory Cube Utilization
Cube utilization looks at how well you’re using the entire three-dimensional space in your warehouse, not just the floor area. It’s a key metric to determine if you’re making the most of your storage capacity or leaving valuable cubic space unused.
Cube Utilization Formula
Here’s the formula:
(Volume of Inventory ÷ Total Storage Volume Available) × 100.
To calculate total storage volume, multiply each rack’s footprint by its vertical capacity, factoring in the warehouse’s clear height (the distance from the floor to the lowest overhead obstruction). For inventory volume, multiply the length and width of your racking area by the height of the tallest load. On average, many warehouses only use about 20% of their potential cubic space.
The ideal range for cube utilization is 22% to 27%. Falling below 22% often signals inefficient rack placement and underutilized space. On the other hand, exceeding 27% can drive up labor costs due to cramped working conditions. As Andi Seabeck, Facility Management Market Leader at Camcode, explains:
"If your storage cube is higher than 27%, you likely have high labor costs because employees lack adequate room to work".
Once you’ve calculated your cube utilization, use it as a benchmark to refine your warehouse layout and improve efficiency.
Adjusting Aisle Widths and Rack Configurations
To further optimize cube utilization, consider narrowing aisle widths. Standard aisles (10–12 feet wide) provide flexibility but limit storage density. Reducing aisle widths to 8–10 feet can increase storage density by up to 25%. Very Narrow Aisle (VNA) setups – requiring specialized equipment like turret trucks or side-loading forklifts – can shrink aisle widths to 5–7 feet, boosting storage capacity by up to 50% compared to wider configurations.
Another approach is adjusting rack beam heights to match pallet dimensions, eliminating wasted vertical space between levels. Installing taller racks that take full advantage of your clear height – while maintaining the required 18 inches of clearance below sprinkler systems – can further maximize vertical storage. For high-turnover items, mezzanines are a smart option, effectively doubling usable floor space without expanding your warehouse footprint.
Tracking Operational Metrics for Storage Efficiency
Operational metrics like put-away accuracy and picking productivity go beyond tracking physical space – they provide a clear picture of how smoothly your warehouse runs day to day. These numbers can highlight inefficiencies in your layout and processes.
Put-Away Accuracy Measurement
Put-away accuracy ensures items are stored in their correct locations. It’s calculated using the formula: (Correctly Stored Items ÷ Total Items Put Away) × 100. Top-tier fulfillment centers typically achieve accuracy rates between 97% and 99.9%.
When accuracy drops, it leads to "phantom stock" – inventory that exists in your system but can’t be found on the shelves. This forces pickers to waste time hunting for misplaced items, increasing labor costs. According to Team Hopstack:
"Fix putaway, and 40–60% of downstream operational issues disappear".
To improve accuracy, adopt scan-to-confirm workflows using barcode or RFID technology. This process ensures that associates scan both the item and its storage bin, updating physical and digital inventory simultaneously in your Warehouse Management System (WMS). This simple method prevents the ripple effects caused by misplaced inventory.
On the other side of the operation, picking productivity offers another lens to evaluate efficiency.
Picking Productivity Measurement
Picking productivity measures how efficiently items are retrieved, calculated as lines picked per labor hour – the total lines picked divided by total picking hours. The industry average is around 71 items per hour, but the real insight comes from what this metric reveals about your warehouse layout.
If productivity is low, it may indicate that high-demand items are stored too far from shipping docks or are in overcrowded areas. For example, if pickers spend over 50% of their time traveling between locations instead of selecting items, it’s a sign your layout needs adjustment. In poorly designed warehouses, travel time can climb to 65%, turning what should be a quick task into a time-consuming one.
Tracking productivity by zone can help identify problem areas. Adjusting your ABC slotting strategy – placing top-selling SKUs closer to packing stations – can make a big difference. Since picking operations account for about 55% of total warehouse labor costs, even small gains in productivity can lead to noticeable savings.
sbb-itb-e2944f4
Using Technology for Real-Time Monitoring
Relying on spreadsheets and periodic audits to track storage metrics often leaves gaps that delay necessary actions. A Warehouse Management System (WMS) equipped with real-time dashboards eliminates these delays by consolidating live data into a single, visual interface, enabling faster decisions. This centralized view allows you to quickly identify areas nearing capacity limits or locate misplaced inventory before it disrupts operations.
Modern WMS platforms monitor key metrics like inventory accuracy, turnover rates, days of supply, and space utilization. The global WMS market is expected to grow nearly 20% annually through 2030, reaching about $8.4 billion, largely due to the demand for instant operational insights. Amit Kumar from Logiwa highlights this benefit:
"A real-time warehouse dashboard cuts through the pains caused by fulfillment network expansion".
The best-run warehouses aim for storage utilization rates between 80% and 85%, striking a balance between density and flexibility. Dashboards make it easy to monitor when you’re approaching these thresholds. Features like visual storage maps highlight underused or overcrowded areas, while heat maps identify high-traffic zones and areas prone to errors. For day-to-day operations, setting a dashboard refresh rate of 30 to 60 seconds allows supervisors to address bottlenecks as they arise. These tools provide a clear snapshot of performance, helping warehouses operate more efficiently.
WMS Dashboard Features
The power of a WMS dashboard lies in its ability to deliver real-time updates and actionable insights. Key features include:
- Space utilization monitors: These track how much of your warehouse’s cubic capacity is being used, helping you avoid unnecessary expansions by identifying empty shelves or overcrowded aisles.
- Inventory accuracy monitors: By comparing book records to physical counts in real time, these tools reduce mis-picks and prevent stockouts.
- Throughput tracking: This measures units per hour (UPH) in different zones, making it easier to spot and address bottlenecks in areas like receiving or picking.
Integration with technologies like barcode scanners, RFID, and IoT devices ensures inventory movements are captured instantly, providing a reliable source of truth. Slotting analytics use real-time data on product velocity and dimensions to recommend the best storage locations, ensuring high-turnover items are easily accessible. The adoption of warehouse automation is also on the rise, with 61% of decision-makers reporting significant or full automation in 2024, up from 49% in 2023.
Role-based views enhance usability by tailoring the dashboard to each user’s needs. Operators see simple workload indicators, supervisors access shift-level analytics, and executives get long-term trends for budgeting and SLA compliance. A color-coded system – green for metrics on target, yellow for those nearing thresholds, and red for areas needing immediate attention – makes it easy to assess performance at a glance. Beyond monitoring, these dashboards enable proactive management through real-time alerts.
Setting Up Alerts for Inefficiencies
Real-time alerts turn your WMS into an active management tool, not just a reporting system. Configure alerts to notify you only when critical thresholds are breached – like when a high-priority zone falls below expected utilization or when slow-moving inventory occupies prime "golden zone" slots near packing stations. This keeps notifications focused on actionable issues.
Alerts can also flag equipment downtime, spikes in back-order rates, or zones with high picking error rates. Considering that picking errors cost the average warehouse about $390,000 annually, addressing these problems immediately can save significant money. Intelligent alerting ensures the right person is notified – whether it’s a floor supervisor for congestion or a manager for capacity issues.
With 37% of warehouse professionals identifying storage areas as the most congested part of their facilities, timely alerts can prevent this from hindering operations. For instance, if a zone hits 85% capacity – the recommended limit to avoid slow picking and restocking delays – an alert can prompt a review of slotting assignments or a transfer of inventory to underutilized areas. This proactive approach helps you catch and resolve issues before they escalate into costly disruptions.
Improving Layout and Slotting for Better Efficiency
Once you’ve implemented real-time monitoring, the next step is to refine your layout and slotting to eliminate wasted space and time. A well-designed layout can recover up to 90% of wasted floor space, while strategic slotting can reduce picking travel time by 30% to 55%. Considering that order picking accounts for up to 75% of warehouse operating costs and 55% of labor time, even modest improvements can lead to significant cost savings.
Start with your layout. Align it with inventory flow to create direct routes from receiving to shipping. For high-volume operations, U-shaped layouts are effective as they allow shared resources for receiving and shipping. On the other hand, I-shaped layouts work best for cross-docking and rapid transfers in larger distribution centers.
Don’t overlook vertical space – it’s often underused. Utilize tall racking, mezzanines, or Vertical Lift Modules (VLMs) to maximize cubic capacity. When choosing equipment, ensure it matches your aisle widths. For example, reach trucks operate in 8- to 10-foot aisles, while very narrow aisle (VNA) trucks need just 5 to 6 feet. To improve safety and efficiency, implement one-way traffic in picking aisles to avoid "forklift standoffs". These foundational layout changes prepare your warehouse for data-driven slotting methods that further enhance efficiency.
Data-Driven Slotting Methods
Slotting begins with ABC velocity analysis, which categorizes SKUs based on pick frequency. Focus on your "A" items – usually the top 20% of SKUs – and place them in the "Golden Zone" (waist-to-shoulder height) near packing stations. This reduces travel time and can speed up picking by up to 30%. Proper slotting also ensures better space utilization, aligning every storage location with operational goals.
A great example of this is VitalBloom, a D2C health and wellness brand. In August 2025, they revamped their fulfillment operations in California and Texas using Hopstack WMS. By implementing rule-based slotting (placing A-class SKUs in golden zones) and dynamic replenishment, they reduced their average pick path from 650 feet to 440 feet per order. Within six weeks, they achieved a 32% improvement in picking efficiency, cut replenishment delays by 75%, and lowered labor costs per order by 24% (from $1.43 to $1.08).
Another effective technique is affinity grouping, which clusters SKUs that are often ordered together – like shampoo and conditioner. This reduces the number of locations visited during picking waves. For instance, software-optimized slotting can decrease stops from 78 to 54 per wave, a 31% reduction. To maintain efficiency, recalculate velocity at least quarterly or before seasonal peaks.
Safety and ergonomics also matter. Store heavy items (over 25 pounds) at ground level to reduce lifting strain, and keep flammables and temperature-sensitive products in appropriate zones. Use heatmaps from your WMS to identify congestion points and ensure high-pick-density "hot spots" are near packing stations. Real-time data adjustments keep slotting aligned with operational metrics.
Advanced Storage Systems
When traditional layout improvements hit their limits, advanced storage systems can unlock additional space and efficiency. Automated Storage and Retrieval Systems (AS/RS) and Vertical Lift Modules (VLMs) can reduce storage footprints by up to 75% compared to traditional shelving and boost order fulfillment speeds by over 500%.
These systems take full advantage of vertical space, reclaiming areas above traditional shelving. With warehouse construction costs rising by 44% since 2021, automation helps maintain the optimal utilization rate of 70% to 85% without expanding your facility. Most businesses see a return on investment within 12 to 18 months after implementing these upgrades.
Integration with your WMS is essential. Advanced systems should provide real-time inventory visibility and automate slotting decisions based on SKU velocity. AI-driven slotting can predict demand spikes and recommend re-slotting in real time. Simulation software helps test configurations, targeting a 15% to 25% reduction in walking distance.
For those not ready for full automation, mezzanines offer a cost-effective way to add floor space. Elevated platforms can be used for manual picking or kitting. Standardize bin sizes with modular dividers to eliminate "dead space" within storage units. A "forward pick" area for high-velocity items, paired with a "reserve storage" area for bulk inventory, minimizes replenishment disruptions.
Conclusion
Improving storage efficiency is an ongoing process that directly affects your bottom line. By monitoring key metrics like space utilization (targeting the 80% to 85% range), cube utilization, and operational factors such as picking accuracy and dock-to-stock time, you can get a clearer picture of your warehouse’s performance. While it might seem tempting to aim for 100% utilization, that level of fullness often leads to congestion and higher labor costs. The real goal is to strike a balance between capacity and efficiency.
With facility costs climbing from $7.96 to $8.31 per square foot between 2022 and 2024, every square foot becomes more valuable. Many warehouses still fail to fully utilize cubic space, leaving room for improvement. Small efficiency gains can not only delay expensive expansions but also boost throughput and cut overhead costs.
As Maveneer puts it:
"Warehouse space is one of the most valuable – and often underutilized – assets in any supply chain operation." – Maveneer
Start by calculating your current metrics to identify areas of underutilization. Techniques like ABC analysis can help optimize slotting, while your WMS dashboard can track these numbers in real time. Set alerts to flag when utilization falls outside your target range. Adjustments like narrowing aisles or re-slotting fast-moving items can lead to noticeable savings.
Efficient warehouses treat optimization as a continuous process. By regularly refining your operations with data-driven strategies, you can create a scalable system that supports growth without driving up costs.
FAQs
How do I measure total usable storage space?
To figure out the total usable storage space in a warehouse, start by determining the total square footage of the building. Then, subtract areas that aren’t used for storage, such as offices, restrooms, or hallways. Once you have the remaining square footage, multiply it by the clear height (the distance from the floor to the lowest overhead obstruction). This will give you the total cubic feet of storage capacity. Understanding this measurement is essential for assessing and improving how efficiently the warehouse space is used.
Why is 100% utilization a bad goal?
When you push for 100% utilization in a warehouse, things can quickly go downhill. Efficiency tends to plummet once you go beyond about 85% capacity. Overcrowding creates bottlenecks, slows down workflows, and drags down overall productivity. The trick is finding the right balance to keep operations running smoothly and get the most out of your warehouse.
Which changes boost efficiency the fastest?
The quickest way to improve warehouse efficiency lies in better space utilization and smarter inventory organization. Simple adjustments, like rearranging aisles, raising shelf heights, or adopting improved storage solutions, can make a big difference. Adding technology into the mix – such as warehouse management systems (WMS), barcodes, or RFID systems – can further simplify operations and yield fast results. Together, these approaches help streamline layouts and introduce automation, leading to noticeable improvements in efficiency.