

Keeping customers is cheaper than replacing them. In ecommerce, new customer acquisition can cost 5 to 7 times more than retention, existing customers often spend 67% more, and a 5% retention lift can grow profit by 25% to 95%.
So if I had to sum up the article in plain English, it’s this:
- I use predictive analytics to spot who may churn, who is worth saving, and when to act.
- I build retention around clean customer data, not broad campaign calendars.
- I use churn scores, CLV forecasts, propensity models, and timing models to decide the next step.
- I send different plays for different customers: replenishment reminders, VIP save offers, onboarding flows, pause options, and win-back campaigns.
- I judge results with holdouts, incremental revenue, and contribution margin, not just repeat orders.
In other words: I stop sending the same message to everyone and start reacting to customer behavior.
A few points stand out fast:
- Win-back sends timed to likely churn windows can recover customers at 2x to 3x the rate of fixed calendar sends.
- Risk-based retention flows can drive 3.2x higher engagement than generic campaigns.
- Churn models can reach 79% to 92% accuracy, but in early ecommerce, simple RFM methods can sometimes beat more complex models.
- For SMS and email, I need to follow CAN-SPAM, TCPA, and state privacy rules like CCPA.
- If model precision in the top 5% drops by more than 15%, it’s a sign to retrain or recalibrate.
The main takeaway is simple: good retention is not about sending more campaigns. It’s about using the right data, picking the right customers, choosing the right offer, and measuring whether the campaign changed behavior.
That’s the thread running through the whole article.
Predictive Analytics for Customer Retention & Lifetime Value | Churn Reduction, LTV Modeling| Uplatz
sbb-itb-e2944f4
Build the Data Foundation for Retention Modeling
Start with one customer view built from every touchpoint. From there, the job is simple in theory and harder in practice: figure out which signals can predict churn, repeat purchase, and lifetime value.
Data Sources That Matter Most
Begin with the inputs that tend to carry the most weight: buying behavior, engagement, and support history.
| Signal Type | What It Includes | Why It Matters |
|---|---|---|
| Transactional | Recency, frequency, monetary value (RFM), product mix, first vs. repeat order history | Shows buying cadence and customer value |
| Behavioral | Site visits, browsing depth, session patterns, category interest, cart abandonment | Shows purchase intent before it happens |
| Engagement | Email opens and clicks, SMS responses, campaign fatigue indicators | Flags attention loss before full churn |
| Sentiment | Support ticket tone, NPS responses, quiz and survey data | Reveals the why behind disengagement |
It also helps to track category shifts over time. A sudden change in what someone buys – or stops browsing – often shows up before churn does.
For brands that sell on marketplaces and their own site, this information usually sits in different systems. That’s a problem. If each channel keeps its own version of the customer, the model only sees part of the story. Pulling everything into a single customer-level view is what makes retention modeling useful. 70% of brands report data silos as a top barrier to effective retention analytics.
These inputs feed the churn, CLV, and propensity models covered next.
Data Quality, Identity, and U.S. Compliance
Once you’ve picked the right signals, tie them back to one customer identity.
Even strong data falls apart when the same person appears under three different IDs. Identity stitching – matching records across Shopify, Klaviyo, and Meta Ads – needs to happen early.
Clean, unified customer history beats fragmented records every time.
Field standards matter too, and this is where teams often get tripped up. Date fields should use MM/DD/YYYY across the board. Revenue should be stored in U.S. dollars ($). If one system defines repeat purchase timing one way and another system defines it differently, model outputs can drift fast and quietly.
On the compliance side, U.S. brands need to account for CAN-SPAM and TCPA rules for email and SMS, along with state privacy laws such as the California Consumer Privacy Act (CCPA). There’s also the iOS issue. Because of privacy limits, email opens are less dependable, so it makes more sense to lean on clicks, repeat purchase rate, and days since last order instead.
Where Emplicit Can Support the Setup

Emplicit can help unify marketplace, site, and marketing data so retention models run on one customer view.
Choose the Right Predictive Models for Retention
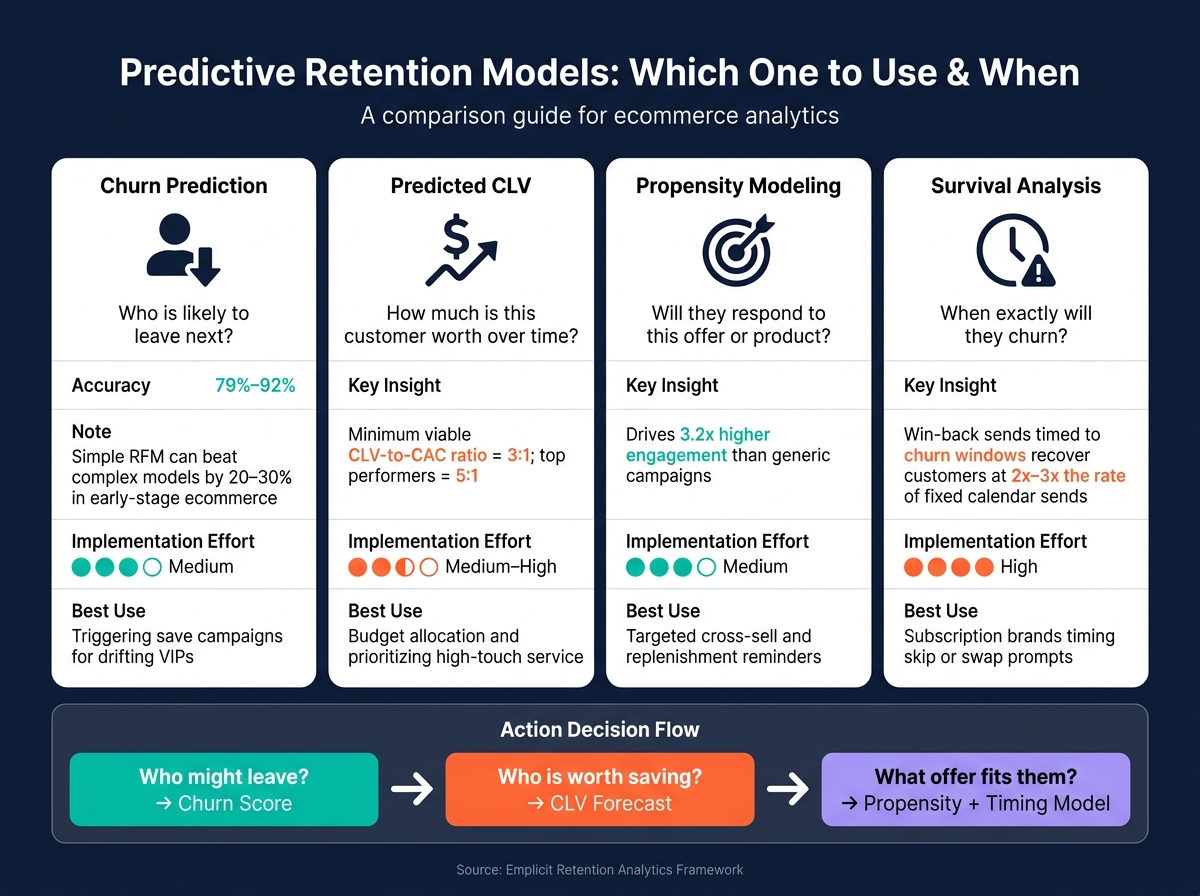
Predictive Retention Models: Which One to Use & When
Once your data is clean, the next step is picking the model that fits the decision in front of you: who might leave, who is worth the spend, and who is likely to respond.
Churn, CLV, and Propensity Models Explained
Each model answers a different business question. That split matters more than it might seem at first.
Churn prediction tells you which customers are likely to leave before they stop buying. Models like XGBoost and Random Forest can hit 79% to 92% accuracy for churn prediction. But there’s a twist: in early-stage ecommerce, when data is still noisy, simpler RFM-based methods can beat more complex models by 20% to 30%. Use churn scores to decide who should get a save attempt.
Customer lifetime value (CLV) forecasting answers: Who is most worth saving? It estimates the total future revenue a customer may generate. That matters when save tactics cost money. CLV scores help you keep higher-cost interventions for customers who justify the spend. Use CLV to decide who should get the costly intervention.
Propensity modeling answers: Who is likely to take a specific action? That could mean responding to an offer, buying a cross-sell item, or placing a replenishment order. Use propensity scores to decide who should get a specific offer.
Survival analysis answers: When exactly will they churn? Timing is the whole game here. This model is useful when you need to place the intervention at the right moment, especially for subscription save prompts.
Turn Scores Into Actionable Segments
A score by itself doesn’t do much. It starts to matter when it triggers a campaign, an offer, or a service move.
The simplest way to make that happen is to combine churn risk with predicted CLV and sort customers into clear groups tied to action. A common setup uses three risk bands:
- High risk: more than 70% probability
- Medium risk: 30% to 70% probability
- Low risk: less than 30% probability
From there, the next move gets much clearer. A high-value customer in the high-risk band may deserve a high-touch response, like personal outreach, a strong offer, or a concierge-style save attempt. A lower-value customer with the same risk level may be better served by an automated email or a smaller incentive. Low-risk customers usually don’t need expensive win-back tactics at all. They’re often a better fit for loyalty nudges and passive education.
| Model Type | Primary Question | Data Needed | Implementation Effort | Best Ecommerce Use Case |
|---|---|---|---|---|
| Churn Prediction | Who is likely to leave next? | RFM, engagement signals, support tickets | Medium | Triggering save campaigns for drifting VIPs |
| Predicted CLV | How much is this customer worth over time? | Historical spend, margin, reorder frequency | Medium to High | Budget allocation and prioritizing high-touch service |
| Propensity | Will they respond to this offer or product? | Past response to offers, category affinity, browsing behavior | Medium | Targeted cross-sell and replenishment reminders |
| Survival Analysis | When exactly will they churn? | Time-stamped event logs, orders, cancellations | High | Subscription brands timing skip or swap prompts |
The point isn’t prediction for its own sake. It’s using scores to make retention action faster, cheaper, and more precise.
Set churn thresholds by product category. Then use those scores as the rules behind risk-based campaigns, offers, and timing. Those rules are what turn model output into save offers that can actually be deployed.
Design Personalized Retention Playbooks
Use churn, CLV, and propensity scores to place each customer into the right retention play. That means picking the channel, offer, and timing by segment instead of sending the same campaign to everyone.
Risk-Based and Lifecycle-Based Campaigns
A simple way to think about it: use churn risk to decide who needs a save play, CLV to decide how much you can spend, and lifecycle stage to shape the message.
First-time buyers need their own post-first-purchase recovery flow. The first 60 days matter most, so use that window for onboarding, product education, and usage tips that help drive a second order.
Active repeat customers buying consumable products should not get generic 30-day reminders. Replenishment should fire at about 70% of the expected depletion cycle – day 21 for a 30-day supply, or day 63 for a 90-day supply.
High-value, high-risk customers need a more hands-on approach. Think concierge-style outreach, early access, and personal check-ins. Skip broad discounting here, since that can eat into margin on customers who may already be close to buying anyway.
Lapsed customers tend to respond best to multi-touch win-back sequences that layer relevance, incentive, and urgency.
| Segment | Strategy |
|---|---|
| High Value / High Risk | VIP Save Flow – early access or concierge service; protects margin and supports very high CLV |
| First-Time Buyer (At Risk) | Recovery Flow – onboarding content plus a small incentive; medium margin impact, high CLV potential |
| Active Repeat (Consumable) | Replenishment – SKU-level reminder timed to depletion cycle; neutral margin impact, high CLV effect |
| Lapsed (Low Value) | Win-Back – deep discount or bundle; erodes margin, low CLV return |
| Top-Decile (Loyal) | Loyalty/Rewards – early access and no-discount perks; low margin impact, very high CLV effect |
Channel, Offer, and Content Personalization
Once you’ve built the segments, match each one to the channel that best fits the job.
Email is best for the why. Use it for welcome series, social proof, education, and re-engagement. SMS is better for short prompts and action-driven moments: reorder reminders based on usage, charge alerts before billing, and one-tap checkout links. SMS open rates top 90% within minutes, and click-through rates are 4–5 times higher than email.
Suppression matters too. Block top-value customers from discount-heavy campaigns so you don’t train your best buyers to wait for a coupon. Keep suppression logic in one place so the same customer doesn’t get duplicate offers in both email and SMS. That helps cut message fatigue and unsubscribes.
Predictive segments can also help you move current customers out of acquisition ads and into retention-focused creative. Instead of re-introducing the brand, those ads should remind people why the product is worth buying again.
Execution Across Marketplaces
The same retention rules should carry across every sales channel. If not, the customer gets one experience on your site and a totally different one somewhere else.
If buyers are spread across Shopify, Amazon, Walmart, and other marketing tools, the playbook needs one shared data layer so execution stays aligned. Emplicit can help bring together marketplace, site, and ad data so retention triggers work across Amazon, TikTok Shops, Walmart, Target, and your own store.
Measure Performance and Improve Over Time
Track Metrics That Reflect Real Retention Gains
Once campaigns go live, measurement tells you which segments, offers, and channels are doing the work. The key is to measure retention lift by incrementality, not by repeat purchases alone. A spike in repeat orders may look good on paper, but it doesn’t show whether your campaign caused those purchases or whether those customers were already on their way back.
The metric that answers that is incremental revenue: the revenue gap between a treated group and a randomized holdout. Pair that with contribution margin – recovered revenue minus offer, shipping, and operating costs – and you can see whether retention is paying off.
That matters because different campaign types come with very different costs. A discount-heavy win-back is not the same as a concierge save. A replenishment reminder is different again. Contribution margin makes those tradeoffs plain.
Beyond those two, a small group of metrics deserves steady attention:
- Repeat purchase rate
- Reorder interval
- Save rate
- Discount reliance
- At-risk revenue
- CLV-to-CAC ratio
For CLV-to-CAC ratio, 3:1 is the minimum level that can hold up over time. Top performers hit 5:1 or better.
Test, Retrain, and Scale What Works
Holdouts tell you whether the campaign caused the result. Model metrics tell you whether the scoring still holds up.
The most dependable way to prove that your retention program is working – and not just moving alongside good outcomes – is to keep a persistent randomized holdout group at the campaign or flow level. That gives you a clean baseline for measuring true uplift.
Model accuracy also slips over time as customer behavior changes. Seasonality, new promotions, and new channels can all shift the pattern. Retrain your models monthly using the most recent 12–24 months of data to keep drift in check.
If precision in the top 5% drops by more than 15%, treat that as a clear warning sign. At that point, the model needs recalibration before it starts wasting money on costly interventions.
Use model performance metrics to spot drift before it burns spend.
| Metric | What It Measures | When It’s Most Useful |
|---|---|---|
| AUC-ROC | The model’s ability to distinguish churners from non-churners across all thresholds | General diagnostics and comparing algorithms |
| Precision | How often an "at-risk" flag is actually correct | When intervention costs are high, such as expensive gifts or human outreach |
| Recall | How many true churners the model successfully caught | When losing a customer costs more than the intervention |
| Lift | How much better the model performs than random targeting | Justifying predictive tools over basic RFM segmentation |
Conclusion: Build Retention Around Data, Not Guesswork
Personalized retention works when it’s tied to clean data, careful testing, and day-to-day execution.
"A usable churn model doesn’t need to feel magical. It needs to help your team prioritize the right customers at the right moment." – MetricMosaic
The practical way forward is simple: start with one focused retention use case and measure it with holdouts and contribution margin tracking. If that use case proves itself, expand model coverage, add channels, and tighten the playbooks. Prove lift first, then grow the parts that improve margin.
FAQs
How much data do I need to start retention modeling?
It depends on your platform and how you set things up. For general ecommerce churn prediction, entry-level tools often need at least 500 customers and 180+ days of order history.
But raw volume isn’t the main thing. Clean, unified, usable data matters more.
You’ll want to pull together:
- Transaction history
- Behavioral data
- Engagement metrics
It also helps to connect data from places like Shopify, marketplaces, and communication platforms so the model has a solid base to work from.
Which retention model should I use first?
Start with simple, rule-based models that use recency and engagement to spot your first at-risk customer segment. You don’t need a complex model on day one. Begin with something your team can understand, trust, and act on.
RFM analysis (Recency, Frequency, Monetary value) is a strong place to start. It helps you spot high-value customers and flag churn risk based on actual behavior. As your data gets better over time, you can layer in more advanced predictive models.
How do I prove a retention campaign worked?
Design the campaign around outcomes the business can verify, like retained revenue and return on investment. That keeps the work tied to money, not just activity.
Use business-focused metrics such as lift to compare the targeted group against a control group. That side-by-side view makes it much easier to see what changed because of the campaign, not because of outside noise.
Define churn in a clear, testable way. For example, treat it as a missed purchase within a set time window. When churn is defined this way, you can connect results back to the intervention with far more confidence.
Regular monitoring, model retraining, and plain reporting keep the results accurate and easy to prove.