

If your inventory numbers are off or slow to update, you lose sales fast. In this piece, I’d boil real-time inventory visibility down to six WMS metrics: inventory accuracy, sync lag, fill rate, stockout rate, oversell rate, and receiving variance.
Here’s the short version:
- Inventory accuracy shows whether system counts match what’s on the shelf.
- Sync lag shows how long it takes inventory changes to reach each sales channel.
- Fill rate shows how much customer demand you ship on the first pass.
- Stockout rate shows how often demand hits zero available inventory.
- Oversell rate shows how often you accept orders for stock you don’t have.
- Receiving variance shows whether inbound stock matches the purchase order.
A few numbers stand out:
- Many teams aim for 97% to 99% inventory accuracy
- Sync updates should often stay under 60 seconds
- Fill rate targets often land around 95% to 99%
- Top teams keep stockout rate under 3%
- A strong oversell target is below 0.1%
- Receiving variance should usually stay under 1%
What I like about this framework is that it shows the chain from dock to customer. Bad receiving data can turn into wrong on-hand counts, then into slow channel updates, and then into stockouts, oversells, cancellations, and lost revenue.
| Metric | What it tells you | Common target |
|---|---|---|
| Inventory accuracy | Are my system counts right? | 97%–99% |
| Sync lag | How fast do channels update? | < 60 sec |
| Fill rate | Am I shipping full demand on first shipment? | 95%–99% |
| Stockout rate | How often is nothing left to sell? | < 3% |
| Oversell rate | How often do I sell stock I don’t have? | < 0.1% |
| Receiving variance | Did inbound stock match the PO? | < 1% |
If I were setting up a dashboard, I’d track each metric by SKU, channel, and fulfillment node, and I’d show both units and U.S. dollars so the team can see where the risk sits first.
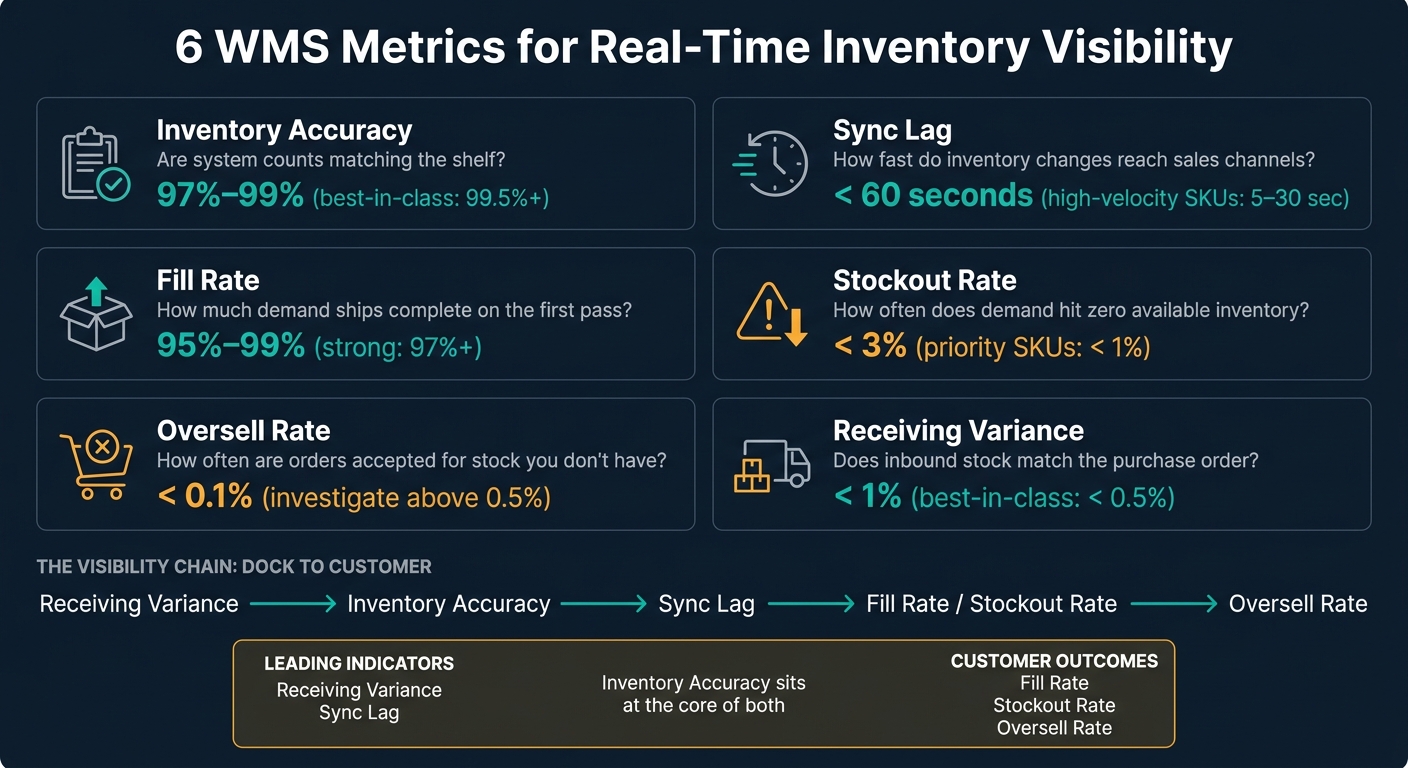
6 WMS Metrics for Real-Time Inventory Visibility: Benchmarks & Targets
Warehouse KPIs to Monitor – Outbound & Inventory Metrics
sbb-itb-e2944f4
Why These WMS Metrics Matter for Omnichannel Operations
Poor inventory visibility leaks revenue and skews marketplace performance. When counts are wrong or updates come in late, you get cancellations, defects, and missed sales. On Amazon and Walmart, cancellations push up Order Defect Rate and Cancellation Rate, which can hurt Buy Box share and listing health. That’s why it helps to split leading indicators from customer-facing outcomes.
These six metrics fit into two buckets, and that split changes how you respond.
| Metric Type | Metrics | What They Signal |
|---|---|---|
| Leading indicators | Receiving variance, sync lag | Data quality issues building before customers feel them |
| Customer outcomes | Fill rate, stockout rate, oversell rate | What customers and marketplaces actually see |
Inventory accuracy sits in the middle of this setup because every downstream metric depends on it.
Leading metrics show where visibility starts to crack. If receiving variance is high, your on-hand counts can’t be trusted before orders even begin to move. If sync lag stretches to 30–60 minutes during peak volume, a sales channel can keep taking orders for units that are already gone. Spotting those upstream issues is far less expensive than cleaning up the mess later.
Customer outcome metrics show what happens when you miss those early warning signs. High oversell rates lead to late shipments and cancellations. Low fill rates lead to partial shipments and bad reviews, especially in categories like apparel and beauty where people expect to get exactly what they bought.
High accuracy and low receiving variance help teams hold less safety stock, cut storage costs, and avoid lost revenue from canceled or corrected orders.
Start with inventory accuracy because every other visibility metric depends on getting the count right.
1. Inventory Accuracy
Inventory accuracy tells you how close your WMS records are to what’s actually sitting on the shelf. The formula is simple:
Inventory Accuracy (%) = (Items where system quantity matches physical quantity ÷ Total items counted) × 100
But the big picture can fool you. A warehouse total might look fine while individual SKUs are off. And those SKU-level errors are what trigger oversells, stockouts, and a lot of avoidable chaos. That’s why SKU-level variance, averaged across the catalog, usually gives you a better read than one big total.
This metric sits at the base of every other inventory visibility KPI. If the count is wrong here, everything built on top of it is shaky too. Nucleus Research found that 46% of organizations increased inventory accuracy within a year of WMS deployment, with an average improvement of 20%. That kind of change matters fast. At 50,000 SKUs, moving from 95% to 99% accuracy cuts inaccurate items from 2,500 to 500 – an 80% drop in inventory errors.
For most ecommerce and omnichannel teams, 97% to 99% is the range to aim for. Top operators often push toward 99.5%+ for best sellers and high-priority locations. Here’s a simple way to read those levels:
| Accuracy Level | What It Signals |
|---|---|
| 95% | Adequate in some operations, but often too low for ecommerce scaling |
| 97% | Common minimum threshold in some guidance |
| 99% | Strong, best-practice level for many warehouses |
| 99.5%+ | Best-in-class |
To find what’s going wrong, break the data out by SKU, location, and channel. That makes it easier to spot repeat variance, trouble zones, and gaps between WMS on-hand inventory and channel-available stock. AI alerts can also flag repeat variance before it turns into an oversell or stockout.
Cycle counting is what keeps the number current. A common setup looks like this:
- Count A SKUs daily
- Count B SKUs weekly
- Count C SKUs monthly
- Clear variances in the WMS with reason codes
That routine cuts down how long inventory stays wrong and helps stop orders from being promised against stock that isn’t there.
Once accuracy is steady, the next thing to watch is how fast those corrected counts show up across every channel.
2. Sync Lag
Sync lag is the gap between a WMS inventory change and the moment that change shows up on your sales channels. If one unit is picked at 10:02 a.m. and Amazon still lists it as available at 10:07 a.m., your sync lag is 5 minutes.
You want to track this at the event level first. Then roll it up into averages, P95 (95th percentile), and max values so you can spot where integrations start to drag. If inventory data stays stale for more than 60 seconds, teams should investigate right away. In high-velocity settings, even a short delay can cause channels to sell stock that’s already gone. That leads to oversells, cancellation emails, and damage to marketplace account health and buy box share.
The main target is under 60 seconds end-to-end. Event-driven updates should usually land in 30–45 seconds. For high-velocity SKUs or promo periods, that window gets much tighter: 5–30 seconds.
| Sync Method | Typical Latency | Best For |
|---|---|---|
| Real-time API push | 1–5 seconds | Flash sales, limited drops, high-velocity SKUs |
| Event-driven / webhook | 5–30 seconds | Production standard for most active SKUs |
| Near-real-time polling | 1–15 minutes | Medium-velocity, stable demand |
| Scheduled batch | 15–60+ minutes | Slow-moving items, internal reconciliation only |
It also helps to track sync lag by channel, node, and event type. That makes it much easier to tell whether the delay comes from a platform API issue, a middleware queue backup, or a process problem on the warehouse floor.
Once sync lag is under control, fill rate shows whether updated inventory is turning into complete orders.
3. Fill Rate
Once inventory updates start moving fast, the next thing to check is fill rate. This metric tells you whether those updates are turning into complete orders. Fill rate measures how fully you meet customer demand on the first shipment, with no backorders and no substitutions. Put simply, it shows whether your inventory promises match what you can ship.
It helps to track fill rate at three levels: order, line, and unit. That way, you can see where things are breaking down. Are you missing whole orders? Just some lines? Or only a few units here and there?
A high unit fill rate paired with a low order fill rate is a classic warning sign. It usually means multi-item orders are arriving incomplete. Customers get most of what they wanted, but not all of it.
| Fill Rate Level | Formula | Best Used For |
|---|---|---|
| Order fill rate | Complete orders ÷ total orders | Overall service level |
| Line fill rate | Complete lines ÷ total order lines | Multi-SKU orders across channels |
| Unit fill rate | Units shipped ÷ units ordered | High-volume or commodity SKUs |
Fill rate issues tend to hit marketplaces hard and fast. A low fill rate leads to more pre-fulfillment cancellations and more late shipments. That can hurt Buy Box share and account health. Teams working across many channels often watch fill rate trends to adjust safety stock and listing quantities, so channel promises stay in line with what inventory can support.
Most targets land between 95% and 99%. Hitting 97%+ is strong, and 98%+ is common for critical service levels. If you’re below 95%, that usually points to a deeper problem. Maybe demand forecasting is off. Maybe replenishment is slow. Maybe available-to-promise logic is wrong. It usually isn’t just a one-off demand spike.
The best WMS drill-downs don’t stop at one blended fill rate number. Break it out by SKU, warehouse, and sales channel.
- By SKU, you can spot products that short-ship again and again.
- By warehouse, you can find network imbalances. One node might run at 98% while another sits at 92% because inbound receiving is slower or inventory is positioned poorly.
- By sales channel, you can see if one marketplace is quietly getting pushed aside when stock gets tight, which can chip away at account health over time.
That makes stockout rate the next upstream metric to watch.
4. Stockout Rate
Stockout rate measures the share of customer demand that runs into zero available inventory.
Put simply: fill rate tells you how much you shipped. Stockout rate tells you when shoppers wanted to buy, but there was nothing left to sell.
Stockout Rate = (Units demanded while SKU was at zero available inventory ÷ Total units demanded in the period) × 100%
If an order line fails because available inventory is zero, it goes into the numerator. Every order line attempted during that time goes into the denominator.
The cost shows up fast. If a SKU brings in $50,000/month and has a 10% stockout rate, that works out to about $5,000 in lost revenue each month. And that’s before you count shoppers who switch brands and never come back. Industry benchmarks put average stockout rates at about 8%, while top operators stay below 3%.
On marketplaces, the hit can snowball. If a listing stays out of stock for several days, its Best Seller Rank and organic placement can drop. Frequent stockouts can also drag down conversion rates, which may tell marketplace algorithms that the listing is slipping. For brands that lean hard on marketplaces, keeping priority SKUs below 1% stockout is a common goal. Safety stock buffers are often used for fast movers.
When fill rate starts to dip, stockout rate helps you see what’s going wrong. Is the issue zero availability? Or are you only filling part of demand? That’s why it helps to track stockouts by SKU, channel, node, and cause code. Doing that separates true demand spikes from receiving delays, quarantine holds, or sync failures.
That split matters. A WMS can show whether zero inventory came from demand, location imbalance, or bad data. Sales channels alone usually can’t show that.
| Drill-Down | What It Reveals |
|---|---|
| By SKU | Chronic items with repeated stockout issues |
| By channel | Channel-specific availability gaps |
| By fulfillment node | Regional shortages despite global inventory |
| By cause code | Whether the root cause is physical, system, or process-related |
A short watch list can go a long way, especially for high-velocity or high-margin SKUs. Then estimate lost sales using price × zero-inventory duration.
Stockouts show missed demand. Oversell rate shows demand promised after inventory was already gone.
5. Oversell Rate
Stockouts show missed demand. Oversells show something else: demand you accepted after the stock was already gone.
Oversell rate tracks the share of orders canceled because a sales channel showed inventory the warehouse didn’t have.
Oversell Rate (%) = (Orders canceled due to out-of-stock orders ÷ Total orders received) × 100
Each oversell can lead to a cancellation, a refund, a support issue, and a hit to seller performance. In one 50,000-order analysis, inventory discrepancies caused 34% of all cancellations, with an average cost of $67 per oversell-related cancellation.
This metric also affects marketplace health. Amazon expects sellers to keep pre-fulfillment cancellation rate below 2.5%. Seller-fulfilled offers can be deactivated if that number stays too high. Walmart Marketplace expects sellers to keep cancellation rate at 2% or less. Since oversells feed straight into these numbers, even a small rate can turn into penalties when order volume jumps.
A good internal target is below 0.1%. Once you’re above 0.5%, that usually points to sync issues, count errors, or receiving problems.
If you want to find the cause, break the metric down by channel, SKU, reason code, warehouse location, and time window. Channel and SKU cuts show where oversells pile up. Reason codes help separate inventory-driven cancellations from customer-requested ones. And if spikes match longer sync intervals, the problem is probably sync lag, not actual stock depletion.
| Drill-Down | What It Reveals |
|---|---|
| By channel | Whether oversells are isolated to one channel or spread across several |
| By SKU | Repeat offenders that may need safety stock or faster sync |
| By reason code | Whether cancellations were caused by inventory issues or customer requests |
| By warehouse/location | Whether one fulfillment node is driving most oversells |
| By time window | Whether spikes line up with promotions, launches, or sync delays |
Oversell rate is the point where inventory data problems turn into a customer-facing issue. When it moves up, check inventory accuracy and sync lag first. If those don’t explain it, look at receiving variance next.
6. Receiving Variance
When oversells and stockouts don’t lead back to sync lag or bad inventory counts, receiving variance is usually the next place to check.
Receiving variance shows how much inbound inventory differs from the purchase order before it becomes available stock. That gap can show up in a few ways: a shortage, an overage, the wrong SKU, damaged units, or an ASN that doesn’t match what physically arrived. Say a PO called for 1,000 units, but the warehouse received only 960 shippable units. In that case, the WMS should log the shortage, damage, and wrong-SKU units as separate issues.
A common operational formula is:
Receiving Variance (%) = (|Received Quantity − Expected Quantity| ÷ Expected Quantity) × 100
For omnichannel teams, it helps to track both saleable receiving variance and total receiving variance. Why? Because available-to-sell counts should reflect what can actually ship, not just what showed up at the dock.
That’s why receiving variance is an upstream metric, not just a receiving-bay check.
This is often where inventory accuracy first starts to slip. A receiving error gets into the system early, then rolls downstream into picking, allocation, channel availability, and artificial stockouts – cases where inventory looks unavailable even though it’s sitting in the building. Recurring variances in the same locations are often tied to receiving or put-away process failures, not theft.
Aim for 99%+ receiving accuracy, with 99.9% as a best-in-class mark. Keep overall variance under 1%; below 0.5% is best-in-class.
| Drill-Down | What It Reveals |
|---|---|
| By supplier | Chronic under- or over-shipments, labeling issues, or ASN mismatches from specific vendors |
| By SKU | Items with recurring discrepancies, often due to similar-looking variants or packaging changes |
| By warehouse/dock | Facilities or receiving docks where process discipline or training may be weaker |
The pattern usually tells the story. If one supplier shows a 5% shortage rate across multiple warehouses, the issue is upstream. If one warehouse shows twice the variance of others across many vendors, the issue is internal – process, staffing, or system setup. That split shows whether the fix belongs with the supplier or the warehouse.
Recommended Tables to Include in Each Metric Section
Use five tables to turn the six visibility metrics into something your team can act on day to day. Since fill rate and stockout rate are closely tied, put them in one table. That way, these metrics work like an operating dashboard, not a pile of reports no one uses.
Table 1 – Inventory Accuracy: SKU/variant, channel/use case, WMS on-hand, channel available quantity, physical count, accuracy %, dollar exposure, notes.
Table 2 – Sync Lag: Group by lag buckets (0–5 min, 5–15 min, 15–30 min, 30–60 min, >60 min). Columns: lag bucket, use case, oversell risk, lost sales risk, customer impact (promise accuracy, cancellations, reviews), marketplace penalty exposure.
Table 3 – Fill Rate and Stockout Rate: SKU, channel, period, lines received, lines filled, fill rate %, stockout events, stockout rate %, current WMS levers, recommended adjustments.
Use Table 4 when you need to split visibility failures from replenishment failures. That distinction matters more than it may seem at first glance.
Table 4 – Oversell vs. Stockout: Oversells are visibility failures; stockouts are planning failures. Two-row contrast across: failure mode, primary causes, customer impact, marketplace impact, WMS prevention levers.
Use Table 5 to trace downstream errors back to the dock. If the problem starts at receiving, this table helps you spot it before it spreads across the rest of the operation.
Table 5 – Receiving Variance: Receipt ID/ASN, supplier, SKU, expected quantity, received quantity, quantity variance %, condition variance, identification variance, location variance, downstream impact, corrective actions.
How the Six Metrics Work Together in One Visibility Framework
These six metrics work like one visibility chain, from the receiving dock all the way to the customer order. If a PO calls for 1,000 units but 30 show up damaged or get counted the wrong way, inventory accuracy takes a hit. And once that starting count is off, replenishment and allocation decisions begin with bad data.
From there, the problem spreads. If sync is delayed, sales channels can show inventory that no longer matches what the WMS says is on hand. That gap can lead to lower fill rates, more stockouts, and oversells. One miss feeds the next, which is why looking at just one KPI can push teams toward the wrong fix.
To manage the full chain, track all six metrics in one dashboard. Use one scorecard to monitor receiving variance, inventory accuracy, sync lag, fill rate, stockout rate, and oversell rate by channel, warehouse, and SKU. That setup makes it much easier to see where visibility starts to break down.
At the channel level, teams can spot where visibility gaps are putting the most revenue at risk across each sales channel. At the warehouse level, they can see whether the problem ties back to a certain facility, 3PL, or receiving process. At the SKU level, they can flag fast-moving items or products with little buffer that are more likely to cause stockouts or oversells when updates lag.
The scorecard should show both daily and weekly views. That way, the team can tell whether they’re dealing with a one-off mismatch or a deeper process problem.
When several metrics get worse at the same time, start at the beginning of the chain and work backward. Check receiving variance first, then inventory accuracy, then sync lag, then fill rate, stockout rate, and oversell rate.
Conclusion
Real-time visibility depends on six connected metrics: inventory accuracy, sync lag, fill rate, stockout rate, oversell rate, and receiving variance. This framework works best when each one is tied directly to revenue impact.
Track every metric in units and dollars. That way, even small rate changes show up in terms the business can act on.
Use daily views to spot spikes fast. Use weekly views to find repeat failures that keep showing up over time.
Channel-level reporting helps teams see where visibility breaks down by marketplace and where safety stock or reorder points need to change.
For teams ready to put this into action, channel-level execution matters most. Brands that want help turning these metrics into marketplace action can work with Emplicit to put visibility into practice across channels.
FAQs
Which WMS metric should I fix first?
Start with inventory accuracy. First, make sure your recorded inventory matches your physical counts. Real-time tracking only works when the starting data is right. If that baseline is off, stockouts and overselling can happen fast.
Run regular audits with barcode scanning to spot and fix discrepancies. In many cases, those gaps come from sync issues. Once your data is dependable, you can improve other metrics with a lot more confidence.
How do these metrics affect marketplace performance?
These metrics have a direct effect on seller ratings and sales across marketplaces. When inventory accuracy stays high and sync lag stays low, you’re less likely to oversell. That helps protect account health and lowers the risk of defects or suspensions.
Strong fill rates, low stockout rates, and tight receiving variance also keep products in stock when shoppers are ready to buy. That means fewer missed sales, less cart abandonment, and better return on ad spend and conversion rates.
How often should I review these inventory metrics?
Review inventory metrics across more than one timeline. For day-to-day work, WMS dashboards should refresh every 30 to 60 seconds so teams can spot bottlenecks as they happen. Then bring those same metrics into weekly team meetings to look at trends and shifts in demand.
For a broader view, use automated reports each day or each week. Run physical inventory audits at least quarterly, and review your full reporting framework once a year.