
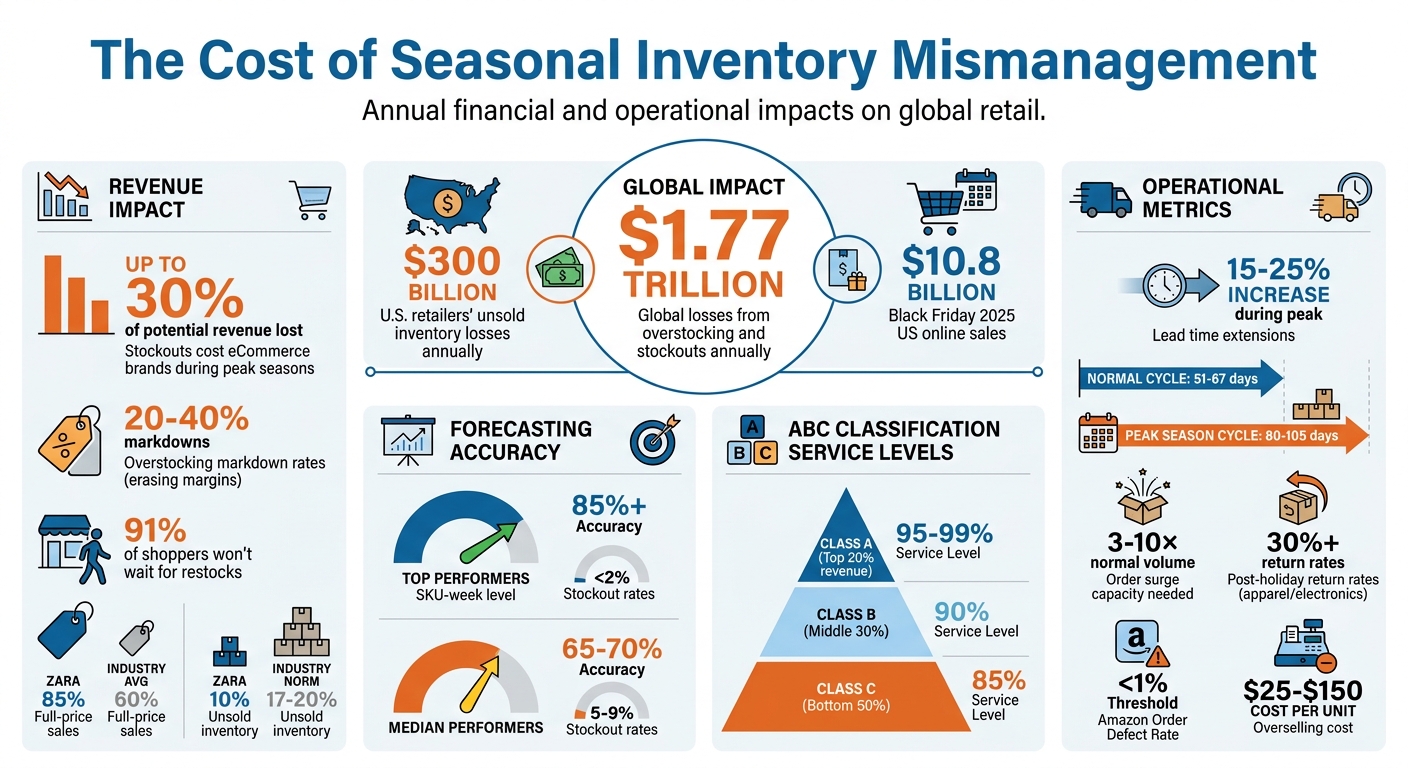
Seasonal inventory issues can cripple profits, but they’re avoidable. Businesses lose billions annually to overstocking and stockouts – $1.77 trillion globally, to be exact. Stockouts alone cost eCommerce brands up to 30% of potential revenue during peak seasons, while overstocking forces markdowns of 20–40%, erasing margins.
The solution? Smarter inventory management. Key strategies include:
- Accurate demand forecasting: Use three years of weekly data and real-time trends to predict seasonal demand shifts.
- Product segmentation: Treat SKUs individually, not as a group, and adjust safety stock levels by demand class (A, B, C).
- Flexible ordering: Stage orders in phases and adjust based on early sales performance.
- Real-time tracking: Monitor daily sales, set stock alerts, and use analytics dashboards to prevent over- or understocking.
Seasonal Inventory Management: Key Statistics and Financial Impact
Why Seasonal Inventory Problems Happen
Unpredictable Seasonal Demand
Seasonal demand is influenced by a mix of factors: holidays, weather shifts, cultural events, back-to-school shopping, agricultural cycles, tourism spikes, and even income patterns. These overlapping triggers create unpredictable surges in demand.
What complicates this further is how shopping windows have expanded. Take Black Friday, for instance – it used to be a weekend event. Now, it stretches over eight or more weeks, fragmenting demand and making it tough to predict the exact timing of spikes. Add in external disruptions like viral trends, sudden weather changes, or competitor stockouts, and even the best forecasts can quickly become outdated.
Here’s the kicker: 91% of shoppers won’t wait for a restock if an item is unavailable. They’ll either buy from a competitor or abandon their purchase altogether. This volatility highlights the importance of accurate forecasting to avoid missed opportunities.
Poor Demand Forecasting
Using annual averages to predict demand is a recipe for trouble. It smooths out the dramatic highs and lows that are typical of seasonal sales. As a result, businesses may find themselves understocked during peak times and stuck with excess inventory during slower periods.
"A one-year category-level forecast with static safety stock causes overstock on slow movers and stockouts on fast movers." – SC Clarity
The real problem arises when businesses wait until after a surge to reorder stock. By then, long lead times often mean it’s too late to meet demand. High-performing supply chain teams manage to achieve 85% or better forecasting accuracy at the SKU-week level during peak seasons. On the other hand, median performers only hit 65% to 70%, which can lead to significant revenue losses and wasted resources.
But forecasting alone isn’t enough – how products are managed during these periods also plays a critical role.
Lack of Product Segmentation
Treating all products the same during seasonal peaks is a common mistake that leads to misallocated stock. Even within a single product category, individual SKUs can have wildly different demand patterns, peak at different times, and come from suppliers with varying lead times.
Applying a one-size-fits-all seasonal uplift percentage across an entire category often backfires. You end up with too much inventory of slow-moving items that occupy valuable warehouse space and tie up cash, while fast-moving products sell out because they’re managed with the same generic buffer. After the season ends, businesses are often forced to discount excess inventory by 20% to 40%, wiping out planned profit margins.
sbb-itb-e2944f4
How to Fix Seasonal Overstock and Stockouts
Better Demand Forecasting
Relying on annual averages for demand forecasting can lead to missed opportunities. These averages tend to smooth out the seasonal spikes that are crucial for planning. Instead, break down your historical data into monthly or four-week intervals to uncover patterns that repeat year after year. Ideally, you should work with at least three years of cleaned weekly shipment or point-of-sale data. This helps distinguish true seasonal trends from one-off anomalies.
A key tool here is calculating seasonal indices. To do this, divide the average demand for a specific month by your overall monthly average. For example, if December sales are typically 40% higher than the monthly average, the seasonal index for December would be 1.4. Use these multipliers to guide your procurement decisions.
But don’t stop at historical data. Incorporate real-time data like point-of-sale trends, social media buzz, and even weather forecasts to fine-tune stock levels during the season.
Preparation is also critical. Start coordinating with suppliers 90 to 120 days before your peak season to secure production capacity. As the season approaches, compress your review cycles from monthly to weekly – or even daily for fast-moving items – starting four to six weeks before the peak.
Finally, refine your stock strategy by segmenting products and tailoring safety stock levels to match the changing seasonal demand.
Product Segmentation and Adjustable Safety Stock
Every SKU or product family needs its own analysis – group-level insights won’t cut it. Products within the same category often peak at different times.
Use ABC analysis to allocate resources effectively. Focus on Class A items (your top 20% by revenue), ensuring a 95% to 99% service level, weekly cycle counts, and aggressive reorder points. Class B items (the middle 30%) can manage with a 90% service level and monthly counts. Class C items (the bottom 50%) require only an 85% service level and minimal safety stock.
Reclassify products as seasonal peaks approach. For example, a gift set that’s a Class C item in June might become Class A during the holiday season.
When calculating safety stock, focus on demand during the peak window, not annual averages. The formula is:
Safety Stock = Z × σ(peak demand) × √(peak lead time)
Here, Z represents your service level factor (e.g., 1.65 for 95%). Multiply this base safety stock by your seasonal index to adjust for seasonality.
Also, account for supplier delays during peak times. Lead times often stretch by 15% to 25% due to industry-wide demand surges, so build in a buffer.
Once you’ve forecasted demand accurately and segmented your products, a flexible ordering strategy can help you navigate seasonal uncertainties.
Flexible Ordering Approaches
Rigid ordering schedules can be a problem when market conditions shift unexpectedly. Instead, consider staged ordering based on weekly sales data. This approach prevents over-ordering, which often results in 20% to 40% markdowns after the season ends.
Break your seasonal orders into multiple phases. Start with a baseline inventory early, then adjust subsequent orders based on sales velocity in the first few weeks. This strategy keeps your working capital fluid and minimizes the risk of excess stock.
For high-risk channels like Amazon and Walmart, display only 85% to 90% of your actual inventory. This helps account for sync delays and avoids overselling.
"A four-week-old forecast in a fast-moving peak season is already stale." – SC Clarity
Diversifying your supplier base for key SKUs is another smart move. This reduces your exposure to production delays or capacity issues. Share your demand forecasts with all critical suppliers well in advance to give them time to scale their operations accordingly.
Optimizing Inventory Management for Seasonal Businesses: Dual Safety Stock & Reorder Point Strategy
Tracking and Adjusting Inventory in Real Time
Real-time inventory tracking is the backbone of staying ahead when demand unexpectedly surges. Pre-season forecasts, no matter how well-crafted, can quickly lose relevance when daily orders spike by 3–10×. That’s why shifting from static forecasting to demand sensing is critical. Instead of relying only on historical data, you can monitor real-time indicators like point-of-sale trends, social media buzz, and recent sales figures to adjust stock levels dynamically. This flexibility allows you to react within days to sudden changes in demand, whether it’s a spike or a slump.
The stakes are high. U.S. retailers lose roughly $300 billion annually on unsold inventory. Real-time tracking gives you the visibility to intervene before those losses pile up.
Using Analytics Dashboards
An effective analytics dashboard should go deeper than broad category summaries. Instead, focus on SKU-level details. Products in the same category often peak at different times, so relying on group-level insights can obscure critical item-level variations that lead to overstock or stockouts.
Here’s what to prioritize:
- Daily SKU Monitoring: Track units sold per day, especially during peak periods. When a product’s sales hit “spike velocity” (about 10× its usual rate), your system should automatically increase inventory buffers by 20–30% to prevent stockouts.
- Stock Alerts: Set up notifications for when inventory approaches safety thresholds or reorder points.
- Channel-Specific Syncing: If you sell across platforms like Amazon, Walmart, and Shopify, even a slight delay in inventory updates can cause overselling during peak traffic. Test your system’s capacity before the season by simulating 5–10× the usual webhook volume to ensure it can handle the load.
"The brands that win peak season are not the ones with the biggest ad budgets. They are the ones whose operations can absorb a 3–10× surge in daily orders without breaking." – Sarah Jenkins, Nventory US
As peak season approaches, consider compressing review cycles. For high-demand SKUs, shift from monthly to weekly – or even daily – replenishment reviews starting four to six weeks before demand spikes. For your top 20% revenue-driving items (Class A SKUs), daily monitoring with aggressive reorder triggers is non-negotiable.
Pre-season testing rounds out this approach, ensuring your systems and strategies are ready before the demand hits.
Pre-Season Testing and Post-Season Reviews
Pre-season testing acts as your final checkpoint before committing to full inventory levels. Running soft launches for VIP customers or loyalty members 4–8 weeks ahead of peak season can reveal actual conversion rates, helping you fine-tune inventory orders based on real customer behavior instead of projections.
One week before peak season, conduct a physical inventory audit of your top 50 SKUs. This step helps resolve any system discrepancies that could lead to overselling during a surge. It’s also your last chance to confirm supplier commitments and ensure safety stock levels reflect peak-specific demand rather than annual averages.
After the season, compare forecasted demand against actual sales for each SKU. Identify the root causes of stockouts or overstock – whether it’s supplier delays, inaccurate forecasts, or syncing issues. Top-performing supply chains achieve 85% demand forecasting accuracy at the SKU-week level during peak seasons, while average performers hit only 65–70%. Use these insights to turn reactive fixes into repeatable processes.
Don’t forget to analyze returns data. Post-holiday return rates for items like apparel and electronics often exceed 30%. Understanding these patterns can further refine your future inventory strategies.
Clearance and Liquidation Plans
Planning your clearance strategy ahead of time is crucial. Relying on real-time sell-through data, you can implement tiered markdowns early to preserve margins. Here’s a simple framework:
- Apply a 10% markdown when 60% of stock remains.
- Increase to a 25% markdown when 45% remains.
- Go to a 50% markdown when only 30% of stock is left.
This proactive approach avoids the deep discounts of panic-driven end-of-season sales and helps recover cash before inventory stagnates.
Zara provides a great example. By monitoring real-time sell-through and triggering markdowns within 2–3 weeks of demand slowing, they sell 85% of their items at full price, compared to the industry average of 60%. Their unsold inventory rate is just 10%, far below the 17–20% industry norm.
"The secret is not luck. It is a system: small production batches, real-time sell-through monitoring, and markdowns triggered within 2–3 weeks of demand deceleration, not months later in panic-driven clearance events." – Luca
For items that remain slow-moving, consider bundling them with bestsellers or offering them as add-ons at checkout. Once stock drops below 20%, flash sales or third-party clearance channels can help you liquidate efficiently.
How Emplicit Helps Prevent Seasonal Inventory Problems

Emplicit takes a proactive approach to seasonal inventory management, ensuring that stock levels are perfectly aligned with peak demand periods. By moving away from outdated methods like relying on annual averages, Emplicit focuses on identifying specific seasonal windows when products sell the most. This smarter strategy ensures reorder points are based on actual peak activity, preventing delays in replenishment when it matters most.
Through SKU-level forecasting and ABC classification, Emplicit prioritizes high-demand items while optimizing safety stock. For example, the top 20% of SKUs – those that generate 80% of revenue (Class A items) – receive focused attention with prioritized safety stock and monitoring. Meanwhile, less critical items (Classes B and C) are managed with reduced resources, freeing up working capital. This approach minimizes the risks of overstocking or running out of stock during crucial seasons.
For brands selling across platforms like Amazon, Walmart, TikTok Shops, and Shopify, multi-platform buffer management is essential. Emplicit implements platform-specific strategies to avoid the hefty costs of overselling, which can range from $25 to $150 per unit. These costs include non-refundable fees, expedited shipping, and customer service expenses.
Custom Inventory Management Services
Emplicit also considers peak season challenges like extended lead times. During busy periods, fulfillment cycles can balloon from the usual 51–67 days to as long as 80–105 days due to manufacturing delays, ocean transit issues, and port congestion. To combat this, Emplicit applies the 100-Day Planning Rule, encouraging brands to place orders early and increase safety stock levels 4–6 weeks before peak season. This ensures inventory arrives in time for critical sales periods, like early November.
For products experiencing sudden viral demand – where sales velocity can spike by 10× or more – Emplicit uses velocity-based throttling to adjust inventory buffers in real time, preventing stockouts. Regular cycle counts, tailored by ABC classification, further eliminate issues like ghost stock. Class A items are reviewed weekly, Class B monthly, and Class C quarterly, ensuring inventory accuracy.
Multi-Platform Marketplace Experience
Managing inventory across platforms like Amazon, Walmart, and TikTok Shops requires unique strategies for each channel. For instance, Amazon enforces a strict Order Defect Rate (ODR) below 1%, with account suspension as a penalty for exceeding it. Walmart requires sellers to meet tight cancellation and shipping metrics, while TikTok Shops demand conservative stock allocations due to the platform’s viral trends and sync latency.
Emplicit also employs geographic inventory positioning, strategically placing stock in fulfillment centers based on demand patterns. For example, more units might be allocated to warehouses in the Eastern US if customer data shows higher demand there. Additionally, before peak season, systems undergo stress testing to simulate 5–10× normal webhook and API traffic. This ensures order management systems can handle massive surges, like those seen during Black Friday, which generated $10.8 billion in US online sales in 2025.
Emplicit’s tailored strategies and preparation ensure brands are equipped to handle the challenges of seasonal demand without missing a beat. By combining data-driven insights with platform-specific tactics, they help businesses avoid costly mistakes and maximize their seasonal opportunities.
Conclusion
Seasonal stockouts and overstock can take a serious toll on revenue and profit margins. These issues often arise from relying on annual averages, insufficient SKU segmentation, and static safety stock levels.
Throughout this discussion, we’ve explored how these challenges can be tackled through three key strategies. First, data-driven forecasting – using at least three years of weekly historical data – provides a clearer picture of seasonal trends and demand shifts. Second, dynamic safety stock recalculations ensure that inventory levels can adapt to fluctuating peak demands. Third, shortened review cycles, starting 4–6 weeks before peak periods, allow for early adjustments to deviations. Together, these strategies form a solid foundation for addressing seasonal inventory challenges. For context, top-performing companies achieve over 85% forecast accuracy at the SKU-week level with stockout rates under 2%, while median performers often see accuracies of 65%–70% with stockout rates between 5%–9% during peak seasons.
Additional flexibility through tools like velocity-based throttling, channel-specific buffers, and geographic inventory positioning helps brands handle order surges of 3x to 10x. Proactively stress-testing systems 30 days before peak demand and aligning cross-functional promotion calendars can also prevent the last-minute chaos that often undermines operations.
By combining these approaches with agile execution, brands can stay ahead of seasonal demands. Emplicit offers tailored inventory management services that bring these principles to life. Through solutions like the 100-Day Planning Rule, SKU-level ABC classification, and multi-platform buffer management, Emplicit helps businesses streamline operations across platforms like Amazon, Walmart, TikTok Shops, and Target. Their expertise in real-time analytics, platform-specific strategies, and geographic inventory positioning ensures brands can overcome challenges like extended lead times and sync delays.
Brands that succeed during peak seasons rely on adaptable operations and precise planning. With the right preparation, flexible strategies, and a trusted partner, seasonal challenges can transform into major revenue opportunities.
FAQs
What data do I need to forecast seasonal demand accurately?
To predict seasonal demand with precision, rely on a mix of historical sales data, market trends, and input from various teams. These tools work together to reveal patterns, prepare for shifts, and ensure your strategy matches what the market requires.
How do I set safety stock for peak season without overbuying?
To determine safety stock for peak seasons without overstocking, focus on the variability in peak demand rather than relying on annual averages. Account for potential supplier delays and increased order volumes by including a 15-25% lead time buffer in your calculations. Leverage data-driven forecasting tools, such as seasonal indices, and combine them with historical trends and real-time sales data. This approach helps you adjust reorder points effectively, ensuring you meet demand surges while minimizing leftover inventory once the season wraps up.
What should I monitor daily to avoid stockouts during a surge?
To avoid stockouts during demand surges, keep a close eye on real-time sales data, inventory levels, and lead times every day. Leverage demand forecasting tools and analyze historical trends to predict potential spikes. Adjust your safety stock levels regularly, especially during peak seasons, to maintain an adequate buffer. By pairing real-time tracking with forward-thinking strategies, you can better manage unexpected increases in demand.