

Here’s the short answer: TikTok leads social engagement in 2026, but that does not mean every ecommerce brand should treat it as the top sales channel by default.
If I had to boil this study down, I’d say this:
- TikTok leads engagement at 2.50% to 3.70%
- Instagram sits far lower at about 0.48% to 0.50%
- Facebook and X trail at about 0.15%
- Live shopping converts best, often at 8% to 12%, with some live commerce cases much higher
- Short-form video drives most TikTok Shop sales, around 60% to 66%
- Small accounts often post higher engagement rates than big brands
- Benchmarks only help when you compare the right peer group
- Clicks, conversion rate, CAC, RPV, and assisted conversions matter more than likes or followers
That last point is the one I’d keep front and center. A post can get views and still do little for sales. On the flip side, a lower-engagement channel can still win if it drives lower CAC, more site visits, or better conversion rates.
Quick comparison
| Platform | Typical Engagement Rate | What I’d Watch Most | Main Caution |
|---|---|---|---|
| TikTok | 2.50%–3.70% | Watch time, shares, saves | Discovery can skew averages for small accounts |
| 0.48%–0.50% | Reels completion rate | Reach is tighter than older studies suggest | |
| 0.15% | Community actions | Organic reach is limited | |
| X | 0.15% | Reposts/shares | Performance is hit-or-miss and event-driven |
I’d use these numbers as a range, not a target. The right way to read them is simple: compare your brand by category, price point, U.S. audience, and account size, then check whether social traffic turns into revenue.
That’s what this summary is about: using benchmark data to make better calls on channels, formats, and spend without getting distracted by vanity metrics.
Core 2026 Platform Benchmarks for Ecommerce
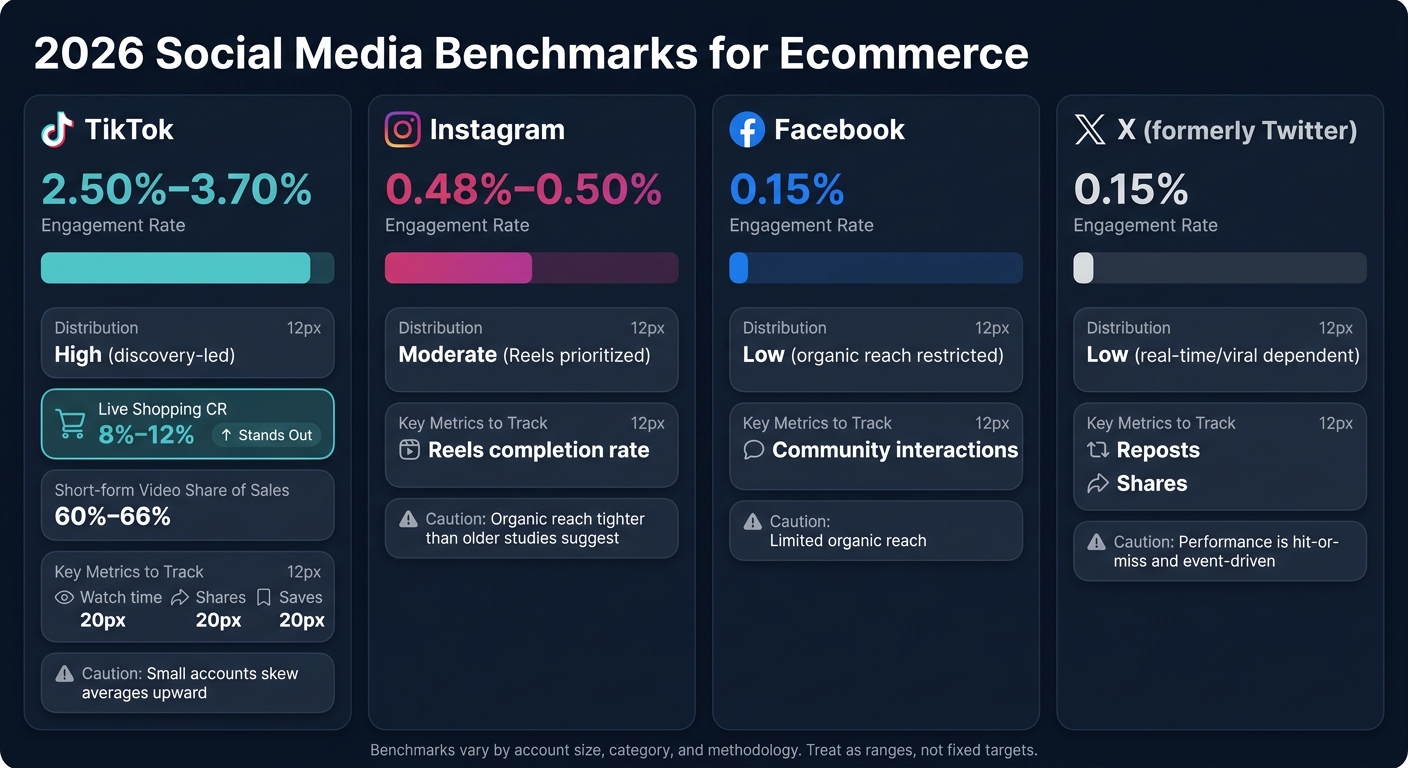
2026 Social Media Benchmarks for Ecommerce: Platform Comparison
Engagement, Reach, and Follower Growth by Platform
The gap between platforms is bigger than many ecommerce teams assume.
TikTok’s engagement rate lands between 2.50% and 3.70%. That’s more than seven times Instagram’s 0.48%–0.50% and close to 25 times Facebook’s 0.15%. X (formerly Twitter) also sits at 0.15%.
That doesn’t just mean TikTok has “better content.” It points to a different distribution model. Some platforms lean into discovery. Others limit organic reach much more heavily.
One catch: account size changes the picture a lot. Smaller accounts tend to push average engagement rates up, so platform comparisons only make sense when you’re matching similar account tiers. On TikTok, engagement per reach is often the better way to read performance because the platform is discovery-led. On Instagram, benchmarks usually look at engagement per follower.
| Platform | Typical Engagement Rate | Distribution Pattern | Track |
|---|---|---|---|
| TikTok | 2.50% – 3.70% | High; discovery favors niche and smaller accounts | Watch time, shares, saves |
| 0.48% – 0.50% | Moderate; Reels prioritized | Reels completion rate | |
| 0.15% | Low; organic reach restricted | Community interaction | |
| X (formerly Twitter) | 0.15% | Low; real-time and viral dependent | Shares/reposts |
These numbers are the starting line. Category, audience mix, and posting cadence can move them up or down.
Click-Through and Conversion Benchmarks for Social Commerce
For ecommerce teams, traffic means little if it doesn’t turn into sales.
CTR and conversion benchmarks split into two buckets: on-platform and off-platform. On-platform shopping tends to convert better because there are fewer steps. Live shopping on TikTok converts at 8%–12%, while broader live commerce benchmarks range from 9% to 30%. Short-form video content converts at 2%–4%, and static shop tabs usually land between 1.5% and 3%. A standard site checkout averages 2%–3%.
Once users leave the platform and head to a brand site or an Amazon listing, more drop-off is normal. That’s where lower friction matters. TikTok Shop cuts steps with two-tap purchases, and 71.2% of TikTok users say they have purchased a product they discovered on the platform.
Brands that send TikTok traffic to Amazon have another lever too: the Amazon Brand Referral Bonus program, which gives sellers credit for sales driven by external traffic.
How Algorithm Changes Affect Benchmark Interpretation
Older benchmark studies can trip teams up fast.
Anything published before 2025 may overstate organic reach, especially for Instagram and Facebook. Both platforms have tightened non-paid distribution, so older averages may not match what a normal post can reach now. If a study doesn’t spell out the date range or whether paid amplification is included, it’s smart to treat those reach figures with caution.
In 2026, TikTok’s algorithm puts more weight on meaningful engagement – especially saves, shares, and watch time – than on simple likes or follower count. Because of that, older engagement benchmarks lose value unless the source shows exactly how the rate was calculated.
That’s also why category-level benchmarks often tell you more than platform-wide averages on their own.
Category Ranges and Posting Patterns That Change Results
How Retail, Beauty, Fashion, Electronics, and Home Goods Compare
Platform averages give you a starting point. Category and format tell you what target to use day to day.
Beauty and fashion often beat platform averages because they sell visual products that people can understand fast. Beauty & Personal Care is the top category on TikTok Shop, with more than $2.5 billion in GMV. In these verticals, live shopping can hit conversion rates as high as 70%.
Electronics usually land lower. The reason is pretty simple: buyers need more context before they buy. They want demos, reviews, side-by-side comparisons, and longer videos that answer basic questions.
| Category | Conversion Notes | Formats to Track |
|---|---|---|
| Beauty | Leading category on TikTok Shop, with over $2.5 billion in GMV; live events can reach 70% conversion | Live Shopping, Tutorials |
| Fashion | Live events can reach 70% conversion | Short-form Video, Live |
| Electronics | Longer purchase cycles; CAC of $76 to $120 | Long-form Video, Reviews |
| Home Goods | Visual discovery driven; search-led discovery | Photo Carousels, Short-form Video |
| Retail | Lower CAC of $30 to $80; high purchase frequency | Short-form Video, Trend Content |
Posting Frequency and Format Benchmarks in 2026
Format can shift the benchmark just as much as category. Live shopping converts at 9% to 30%, while static shop tabs sit much lower at 1.5% to 3%. So if a team mixes those together, the numbers can get messy fast. Benchmark each format on its own.
Short-form video drives 60% to 66% of TikTok Shop sales. Video length matters too. The current sweet spot is 30 to 60 seconds, but 3- to 10-minute videos get about 2x the views of very short 6- to 10-second clips. That may sound backward at first, but it makes sense when the product needs a bit of explanation.
Audio plays a big part as well. Videos with background music get 98.31% more views than videos without it.
Photo carousels still have a place, especially for posts that need more detail. If you’re sharing product education, specs, or step-by-step use cases, that format can still do the job well. Track live, short-form, and static content as separate groups.
Why Account Size and Growth Stage Affect Averages
Smaller accounts can post higher engagement rates than much bigger brands because TikTok’s interest-graph model can push early traction without relying on follower count. In plain English: a small account can catch a wave fast.
That can make engagement percentages look better for smaller profiles. Meanwhile, larger brands may post lower engagement rates while still driving much more traffic, sales, and revenue.
The safer move is to compare accounts by follower tier and business stage. Use similar brackets – like 10K to 50K or 100K to 500K – before you decide whether an account is underperforming or doing fine.
sbb-itb-e2944f4
How to Benchmark Against Peers Without Using Vanity Metrics
The Metrics That Matter Most for Ecommerce Teams
For ecommerce teams, the goal is simple: track metrics tied to revenue, not likes or follower counts.
The ones that matter most are engagement rate, reach rate, follower growth rate, CTR, CPC, CPA, conversion rate, RPV, CAC, and assisted conversions.
Each metric answers a different business question. A low CTR usually means the creative isn’t landing or the audience is off. A high CTR with a low conversion rate usually points somewhere else. In most cases, the problem is on the product page, not in the content itself.
Assisted conversions matter even more in 2026 because consumers now interact with brands across an average of 9.5 touchpoints before converting. Social might not be the last click, but it often gets the process started. That’s why saves and shares deserve attention too. They show that content is useful, and they often do a better job of signaling future reach than likes.
Of course, none of these numbers mean much in a vacuum. They only help when you compare them with brands in the same category, at a similar price point, in the same geography, and with a similar account size.
How to Build a Valid Peer Group
A global average doesn’t tell most U.S. brands much. A U.S.-based peer set is far more useful.
A valid peer group uses four filters:
- Same product category
- Similar price point
- Similar audience geography
- Similar account size
Use this framework to turn raw metrics into apples-to-apples comparisons:
| Benchmarking Step | Data Needed | Source | Interpretation |
|---|---|---|---|
| 1. Define Peer Group | Category, price point, geography, account size | Market research, competitor profiles | Keeps the comparison aligned across markets and business stages |
| 2. Collect Internal Metrics | CAC, conversion rate, AOV, RPV, assisted conversions | GA4, Shopify/BigCommerce, Ads Manager | Sets your current performance baseline |
| 3. Gather Industry Benchmarks | Category-specific CAC, average engagement, platform CR | 2026 study summaries, platform analytics | Shows where your brand stands against the market average |
| 4. Run a Gap Analysis | Delta between internal and peer metrics | Comparison of Steps 2 and 3 | High CTR + low conversion rate = landing-page friction |
| 5. Make Channel Decisions | Format performance (live vs. video vs. static) | Platform native analytics | Helps show whether to scale content volume or shift formats |
Turning Benchmark Data into Channel Decisions
Once the peer set is defined, benchmark gaps start to point toward channel decisions.
If CTR is high but conversion rate is low, the issue likely sits on the product landing page or in the price point, not in the social content. That changes what you do next. Instead of chasing follower growth, test different formats like live selling or photo carousels, which may drive higher RPV.
Use the gap analysis to adjust creative, landing pages, and channel spend.
Methodology Limits and Key Takeaways
What Benchmark Studies Can and Cannot Tell You
Before you use the 2026 benchmarks above, look at how the data was put together. For ecommerce teams, shaky methodology can turn a peer comparison into a bad read. Benchmarks can show direction, but they shouldn’t be treated like fixed goals.
That matters even more in 2026, because published social averages often don’t line up. Different studies use different formulas, different samples, and sometimes different definitions of the same metric. TikTok’s average engagement rate is a good example: one study puts it at 2.50%, another at 3.73%, and a third at 4.07%.
That’s the whole point: methodology matters more than the headline number.
A few limits make blind trust in benchmark studies risky. Many platforms don’t release full audience data, and private-company revenue figures often come from analyst estimates instead of audited statements. Broad category averages can also lump together product types that don’t belong in the same bucket. And platform shifts can change results fast. In 2026, TikTok favors longer, original videos over repurposed content.
So use outside data with care:
- Update benchmarks quarterly
- Verify each figure against a primary source
- Treat outside numbers as ranges, not targets
Key Points Ecommerce Teams Should Carry Forward
With those limits in mind, use benchmarks as input, not a verdict. Your first-party data matters more than any industry average.
External benchmarks show where the market sits. Your own analytics show where your brand sits. The distance between those two is where the useful decisions start. That’s where teams decide what to change in content, spend, and landing pages.
A few rules help keep that comparison honest:
- Match formulas exactly before comparing internal and external metrics.
- Segment by platform and category; one cross-platform average serves neither.
- Ignore follower count and raw views when judging revenue impact. Focus on profile visits, website clicks, saves, direct-to-site conversions, and overall marketing ROI – the numbers that tie social activity to revenue.
- Weight saves and shares more than likes. TikTok’s algorithm prioritizes these signals, and they do a better job showing future reach and content usefulness.
Benchmarks do their best work as a diagnostic tool. They show where clicks or conversions trail peers and point to what needs a closer look. That becomes even more important when CTR, profile visits, and direct-to-site conversions aren’t moving in the same direction.
They still don’t replace judgment. And they can’t account for creative quality, paid amplification, or audience fit. Those factors still live inside your own data.
FAQs
How should I choose the right peer group?
Pick a peer group based on audience fit and day-to-day business alignment, not vague industry tags. Look for brands that serve similar customers, operate at a similar size, and sell in the same markets, with extra weight on brands going after U.S. consumers.
Then compare the things that tell you whether that peer set makes sense: audience quality, posting cadence, and how well the content lands. Keep your benchmarks tied to the same core metrics each time, like engagement rate, reach, and revenue in USD ($), so the data stays useful instead of drifting into vanity metrics.
Which social metrics matter most for sales?
For 2026 sales, ecommerce teams should put conversion-focused metrics ahead of vanity signals like likes or follower counts.
That means keeping a close eye on GMV, conversion rate, and ROAS. These numbers tell you what’s actually driving sales, not just what looks good on a dashboard.
It also helps to track customer journey metrics like CTR, Product Show Rate, and CTOR. Those give you a clearer view of where shoppers lose interest or drop off before buying.
And don’t stop at platform-reported results. Use MER to compare total revenue against total ad spend, since platform attribution can overstate impact.
When should ecommerce brands prioritize live shopping?
Ecommerce brands should put live shopping high on the list when they want more efficient conversions and need to push back against rising customer acquisition costs. On TikTok, live shopping often converts at 8%–12%, and in niche events it can hit 30%+, compared with the 2%–3% baseline many standard ecommerce stores see.
This format works best when brands need real-time interaction. It gives shoppers a chance to ask questions on the spot, watch product demos, and jump into giveaways that spark immediate action. It also helps brands stand out in a crowded feed and build owned audiences instead of leaning only on paid acquisition.