
If your TikTok Shop commission rate is off by a few points, your profit can disappear fast. In H1 2026, TikTok Shop U.S. hit $32 billion in GMV, while many brands saw blended cost of sale land around 28% to 38% of revenue once commissions, ads, and overhead were added.
If I were setting a TikTok affiliate commission structure today, I’d keep it simple:
- Start with margin math first
- Set a base rate from what the product can afford
- Use Open Plans for scale and Targeted Plans for control
- Pay more only for proven creators or priority SKUs
- Watch refunds, cancellations, and payout delays
- Test one change at a time and judge results by net profit, not just sales
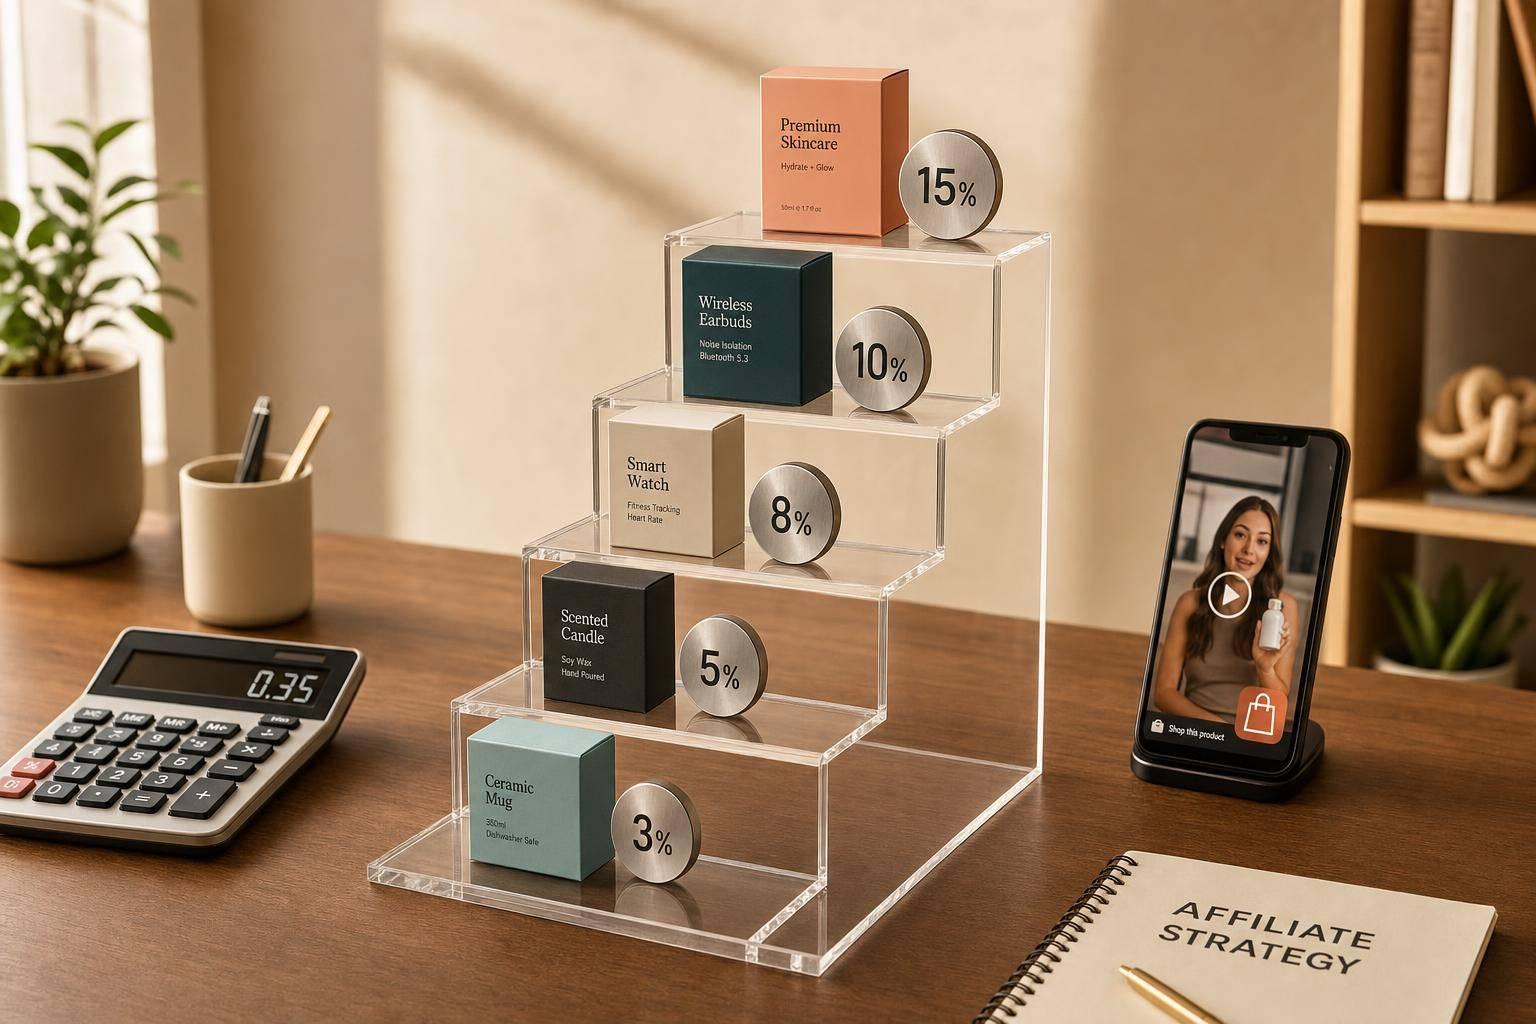
Most TikTok Shop affiliate rates sit around 5% to 20%, with many beauty and apparel products in the 12% to 15% range. New launch products may need 18% to 20% to get attention, while low-margin items often need to stay closer to 5% to 8%.
Here’s the short version: I’d use one default shop rate, add a few SKU-level overrides, tier creators by sales quality, and keep total selling cost under control before scaling. That gives you a clean way to grow without paying too much for weak results.
TikTok Shop Commission Strategy: Set Rates That Attract Affiliates
sbb-itb-e2944f4
Set base rates and build the right commission logic
Once you know your margin ceiling, set rates that protect profit and still give creators a reason to push.
Calculate a base commission rate from margin and growth goals
Start with your selling price. Then subtract COGS, platform fees, shipping, returns, and planned ad spend. What remains is your commission ceiling.
On TikTok Shop, affiliate rates usually fall between 5% and 20%. Beauty and apparel often land around 12% to 15%, while home goods tend to sit closer to 10% to 15%.
Use different rates for open plans, targeted deals, and Shop Ads
Once you have a base rate, don’t apply it the same way across every setup. The plan type matters. Your paid ads plan matters too.
Use lower rates for Open Plans and save higher rates for invited creators in Targeted Plans. If you plan to boost affiliate content with paid ads, put a cap on the total cost of commission plus ad spend before you scale. That keeps a good-looking campaign from turning into a margin leak.
Build tiered commissions that reward verified performance
A flat rate sounds simple, but it creates a problem fast. You either pay too much to weak performers or give your best creators too little reason to keep going.
A tiered setup fixes that. Start every creator at your base rate. As they show steady sales and solid content results, move them to a mid-tier payout. Keep your top rate for your strongest creator group.
A simple three-tier model works well for most brands:
- Base tier: default rate for new creators
- Mid tier: higher rate for creators with steady sales and dependable content
- Top tier: highest rate for creators that drive the most sales
Only move creators up after they hit clear performance thresholds. That helps limit payout risk in the first few weeks, when you’re still figuring out whether a creator can sell your product, not just make content that looks good on the feed. It also gives creators a clear target they can work toward.
The next step is to segment creators and products so higher rates go only where they earn their keep.
Segment creators and products to protect margin
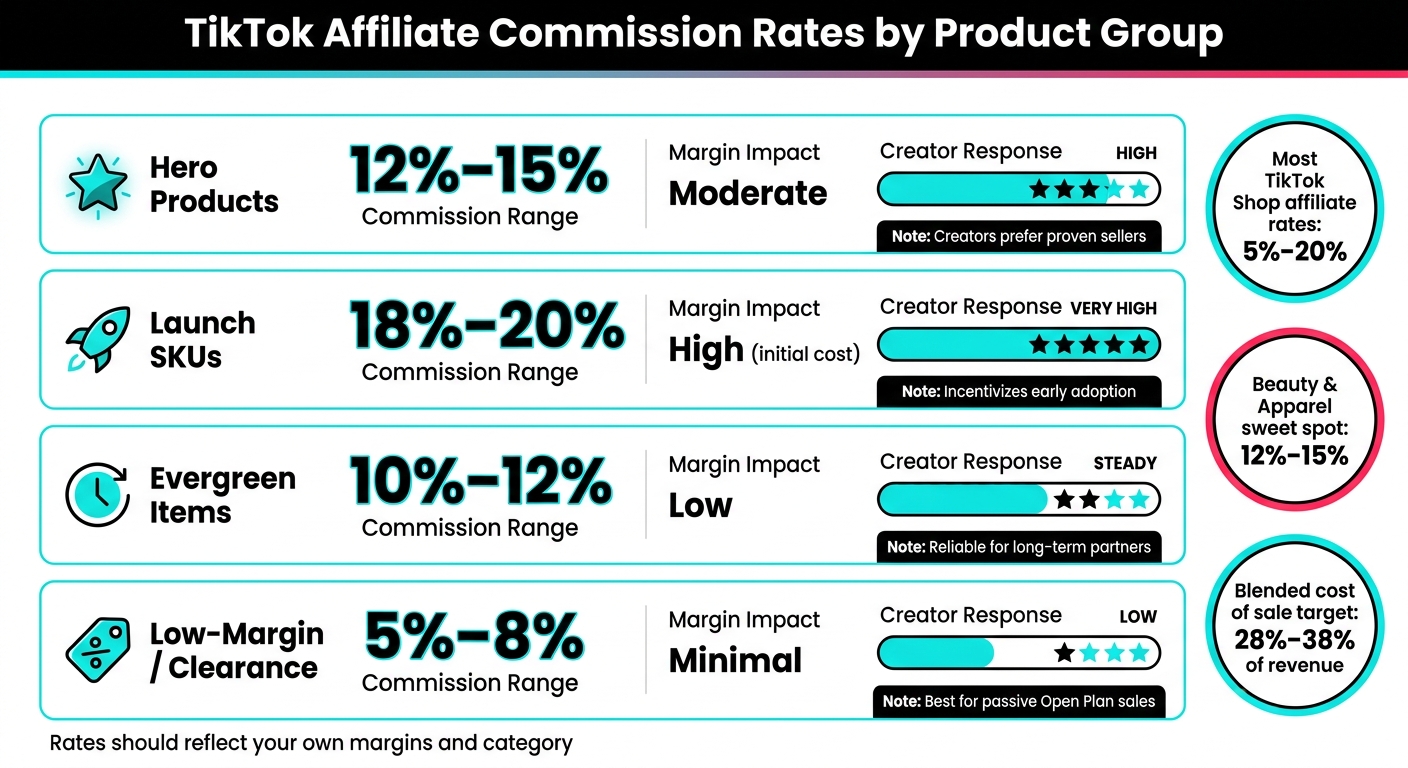
TikTok Affiliate Commission Rates by Product Group
Tiers give you the structure. Segmentation decides who gets which tier – not just who gets into the program in the first place.
If you skip this step, you can end up paying the same commission to creators who have very different sales upside. That’s where margin starts to slip.
Segment creators by performance, niche, and reliability
Start with the numbers that matter most: GMV history, live selling experience, conversion rate, and refund rate. Then look for warning signs, like sudden follower spikes, weak engagement, or past sponsorship disputes.
Live selling experience should carry extra weight. Live shopping conversion rates can range from 9% to 30%, while short-form video often lands around 2% to 4%. That gap is hard to ignore.
Past that, niche fit and refund rates help fill in the picture. A creator might have reach, but if their audience doesn’t line up with the product, the sales may never show up. And if refunds run high, those sales can look better on paper than they do in your margin report. Mid-tier and micro-influencers often produce better ROI because their audiences tend to be more engaged.
A simple way to use this:
- Put lower-risk creators into Open Plans
- Save Targeted or Managed access for vetted, high-performing partners
- Pay higher rates only when creator quality and product economics support it
That way, commission rates follow business logic instead of guesswork.
Group products by margin, launch priority, and return risk
SKU overrides are there for a reason: they let you pay more on products that can handle it.
The easiest setup is to use one default commission rate, then add overrides only for the SKUs that need different economics. That keeps the program easier to run without flattening everything into one rate.
Here’s how product groups usually break down:
- Hero products with a proven sales history can often support 12%–15%. The sales volume helps offset the commission cost.
- New launch SKUs may need 18%–20% to get creators interested in something that doesn’t have a track record yet.
- Evergreen items with steady demand usually fit in the 10%–12% range.
- Low-margin or clearance products should stay at the low end, often 5%–8%, and usually work best in Open Plans where organic discovery does more of the heavy lifting.
Return risk matters too. Lightweight products that qualify for Fulfilled by TikTok (FBT) tend to convert 12%–18% better because of the delivery promise badge. That lift can support a slightly higher commission if the added volume covers the extra payout. On the other hand, high-return categories need tighter rate control if you want to keep margin in check.
Commission rate comparison by product group
The table below shows common product groups, suggested commission ranges, margin impact, and how creators tend to react. These are sample ranges – your actual rates should match your own margins and category.
| Product Group | Suggested Commission Range | Margin Impact | Expected Creator Response |
|---|---|---|---|
| Hero Products | 12%–15% | Moderate | High; creators want proven sellers |
| Launch SKUs | 18%–20% | High (initial cost) | Very high; incentivizes early adoption |
| Evergreen Items | 10%–12% | Low | Steady; reliable for long-term partners |
| Low-Margin/Clearance | 5%–8% | Minimal | Low; used for passive Open Plan sales |
Use one default rate and only a handful of SKU overrides. It keeps payout timing and performance tracking from turning into a mess.
Manage payouts, testing, and post-launch performance
With your rates and tiers in place, the next job is payouts, testing, and performance control. This is the last control layer after base rates and segmentation. It’s also where cash flow, creator relationships, and margin either stay in line or start drifting.
Plan for settlement windows, clawbacks, and cash flow timing
TikTok Shop commissions settle with a delay, so your payout timing should match those settlement windows. You’ll also want a reserve for refunds or cancellations. That timing matters more than it may seem at first. Faster payout schedules can keep creators active and happy. Slower ones give you more breathing room when reversals hit.
Track refund rate in your dashboard so you can catch reversals early.
Once payout timing is stable, start testing rates and tiers in controlled rounds.
Run structured tests on rates, tiers, and product groups
Don’t change several things at once. Test one variable at a time: rate, tier structure, creator access, or fulfillment method. If you change too much in one round, it gets hard to tell what actually moved the numbers.
| Test Setup | Variable Changed | What to Measure | Signal to Watch |
|---|---|---|---|
| Rate A vs. Rate B | Base commission rate | Creator activation, GMV, net profit | Does the higher rate drive enough extra volume to justify the cost? |
| Two-Tier vs. Four-Tier | Tier structure complexity | Creator progression, payout distribution | Does the added complexity change behavior enough to justify the admin work? |
| Open Plan vs. Targeted Plan | Creator access model | Conversion rate, refund rate, brand control | Does tighter control improve margin without reducing volume too much? |
| FBT vs. Self-Fulfilled | Fulfillment method | Conversion rate, settlement speed | Does the 12% to 18% conversion lift justify the logistics tradeoff? |
After each test, compare creator activation, conversion rate, GMV, and net profit. Then make one adjustment before the next cycle.
For early commission testing, focus on mid-tier creators with 50,000 to 500,000 followers. They usually give the steadiest performance data.
Track the KPIs that show whether the structure is working
Judge performance against the margin ceiling you set earlier, not just revenue. More sales can look good on the surface while profit slips underneath.
The main metrics to review are:
- Attributed revenue
- Gross profit
- Net profit after commission and ad spend
- Average order value (AOV)
- Conversion rate
- Refund rate
- Blended cost of sale
It also helps to watch concentration by creator tier and product group. If one creator or one product cluster starts driving too much of total GMV, that can turn into a dependency risk fast.
| Dimension | Key Metrics to Review | Red Flag |
|---|---|---|
| By Creator Tier | GMV share, conversion rate, refund rate | Heavy concentration in one creator or tier |
| By Product Group | Conversion rate, AOV, net profit per SKU | Net profit margin below target after commission |
| Program-Wide | Blended cost of sale, gross profit, net profit | Blended cost of sale exceeding 38% of revenue |
At scale, brands on TikTok Shop often see blended cost of sale land between 28% and 38% of revenue once creator commissions, ad amplification, and operating overhead are included. If you move above that range, the commission structure is usually the first place to check.
Conclusion: Build a commission structure you can scale
After base rates, tiers, segmentation, and testing, the last step is making sure the structure can grow with you. A TikTok affiliate commission structure that lasts over time is not just one flat rate. Start with your margin math, then set each commission rate against your cost ceiling.
Each plan type has a clear job. Open plans help you scale fast and get more organic discovery, but they give you less control. Targeted plans let you work with specific creators and set terms more carefully. Once creator access is in place, line up product economics with the right commission level. Group products by margin, give higher rates to launch SKUs, use lower rates for low-margin or clearance items, and test one variable at a time. If you move into paid amplification, wait until organic performance has already proven itself.
The best commission structures protect margin, reward strong performance, and stay simple enough to run without turning into a mess. Build around margin first. Then reward performance, test in cycles, and scale only what stays profitable.
Emplicit helps brands build commission structures based on margin targets, creator segmentation, and program management that can grow over time.
FAQs
How do I calculate a profitable commission rate?
Work backward from your target net margin using your unit economics. That means looking at the numbers from the sale price down, not just guessing what “feels” profitable.
Make sure you count every cost, including:
- the 6% TikTok Shop referral fee
- shipping
- return handling, which is about $3.00 per item
- payment processing, usually 2.9% + $0.30 per transaction
Once you stack those costs together, the picture gets a lot clearer. In many cases, total costs, including affiliate commissions, can hit 32% or more.
That’s why it’s usually smart to keep your Cost of Goods Sold below 40% of the selling price. If you don’t, your margin can disappear fast. On paper, a product might look like a winner. After fees, shipping, returns, and commissions, it can turn into a much thinner deal than expected.
When should I use Open Plans vs. Targeted Plans?
Use Open Plans when your main goal is fast growth. They let any eligible creator promote your products without needing approval first, which makes them a good fit for early discovery and broad visibility.
Once you know which creators perform well, move to Targeted Plans. They give you tighter control with private rates and exclusive invites, which helps you manage brand positioning, content quality, partnership costs, and the risk of undercutting.
Which metrics matter most after launch?
After launch, track a mix of commerce, creative, and attribution metrics so you can tie that first impression to the final purchase.
- Commerce: GMV, net sales, total orders, conversion rate, ROAS, CPA, and AOV
- Creative: views, watch-through rate, likes, comments, shares, saves, and CTR
- Attribution/behavior: affiliate links, promo codes, UTM performance, CTA, VTA, and repeat purchase rate