
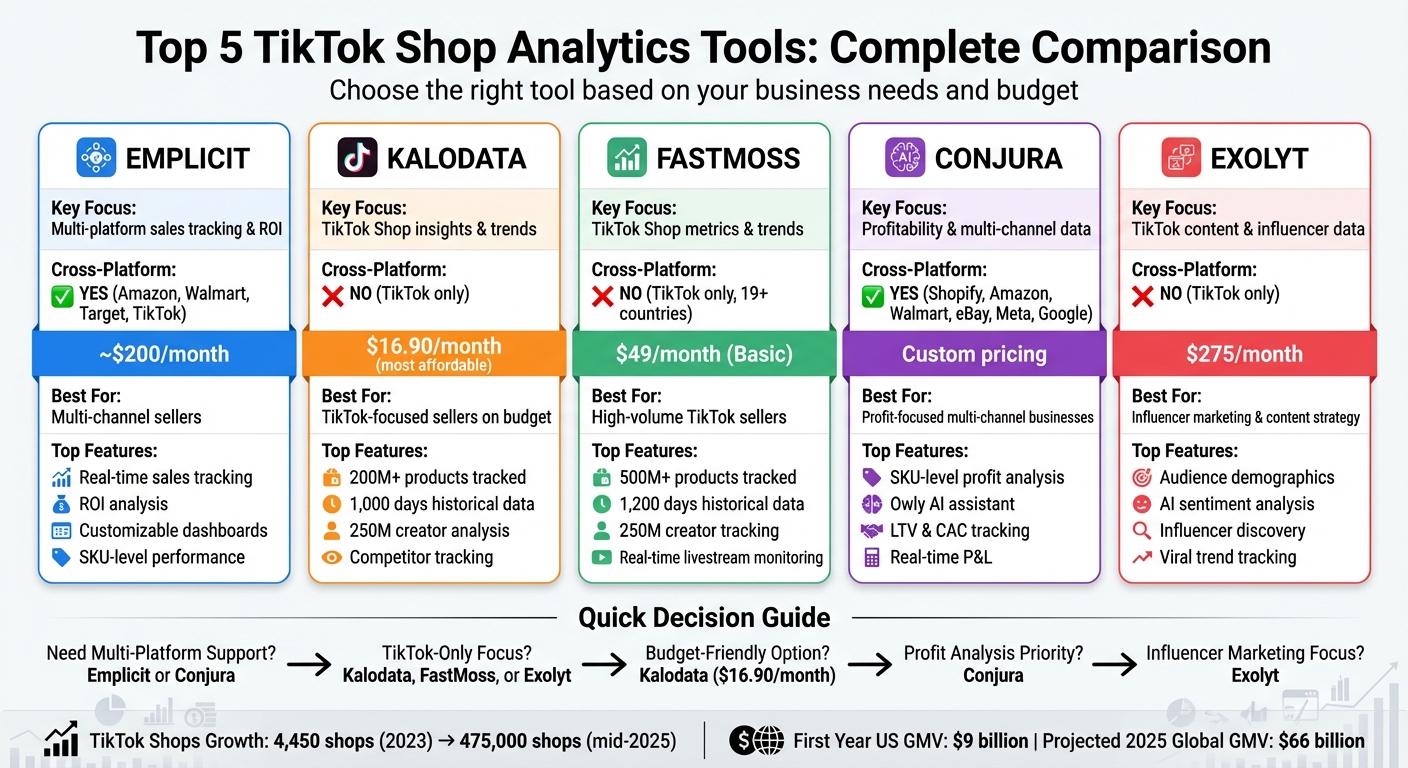
TikTok Shops has transformed e-commerce, growing from 4,450 shops in 2023 to 475,000 by mid-2025, with $9 billion in GMV during its first U.S. year. For sellers, managing data effectively is critical to success, as TikTok’s native dashboard lacks detailed insights like shipping costs, refunds, and profitability metrics. Here’s a breakdown of the top tools to simplify data visualization and improve decision-making:
- Emplicit: Combines TikTok Shop data with other platforms like Amazon and Walmart. Offers real-time sales tracking, ROI analysis, and customizable dashboards.
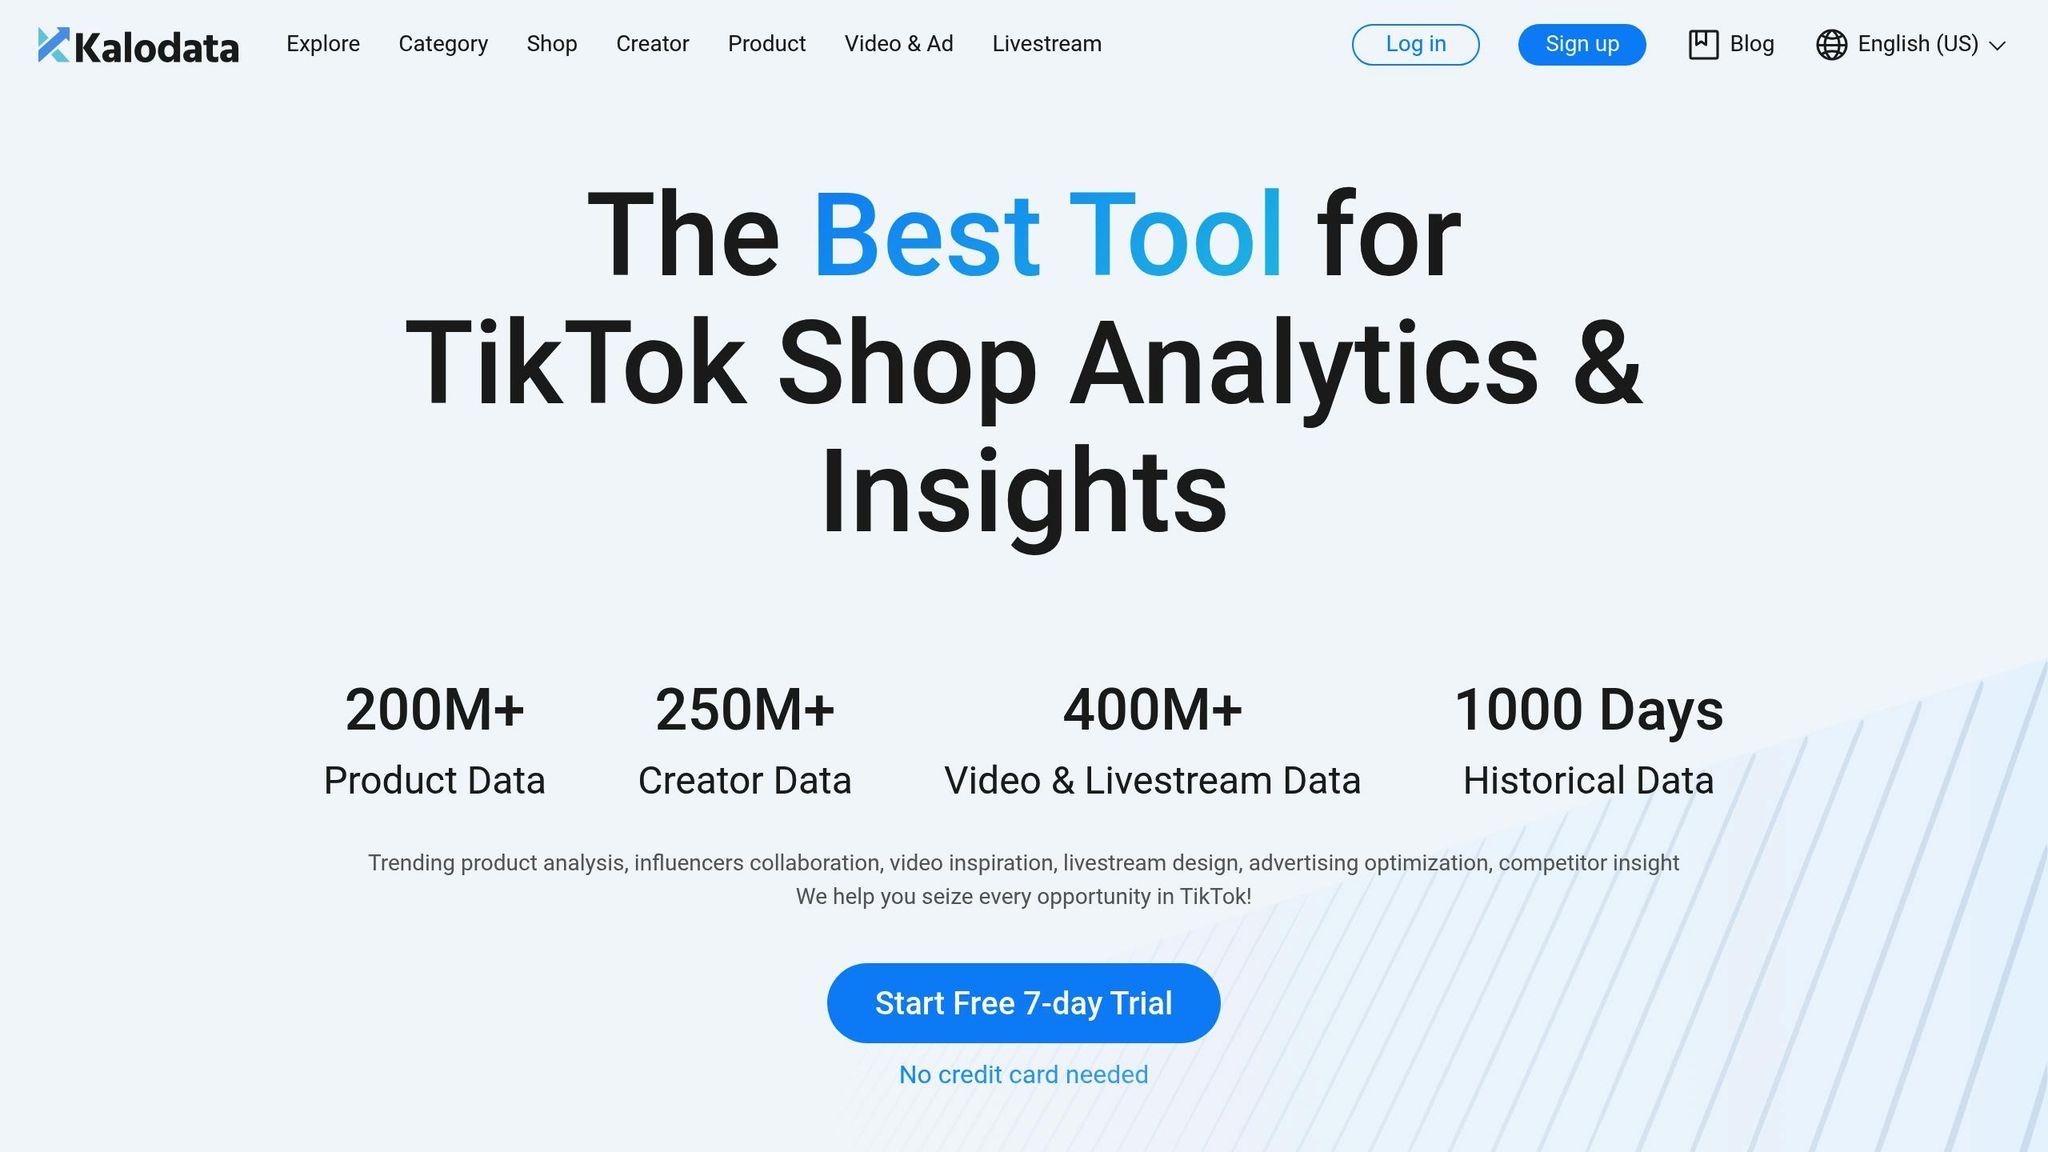
- Kalodata: Focuses solely on TikTok Shops. Tracks 200M+ products, provides 1,000 days of historical data, and analyzes influencers for targeted marketing.
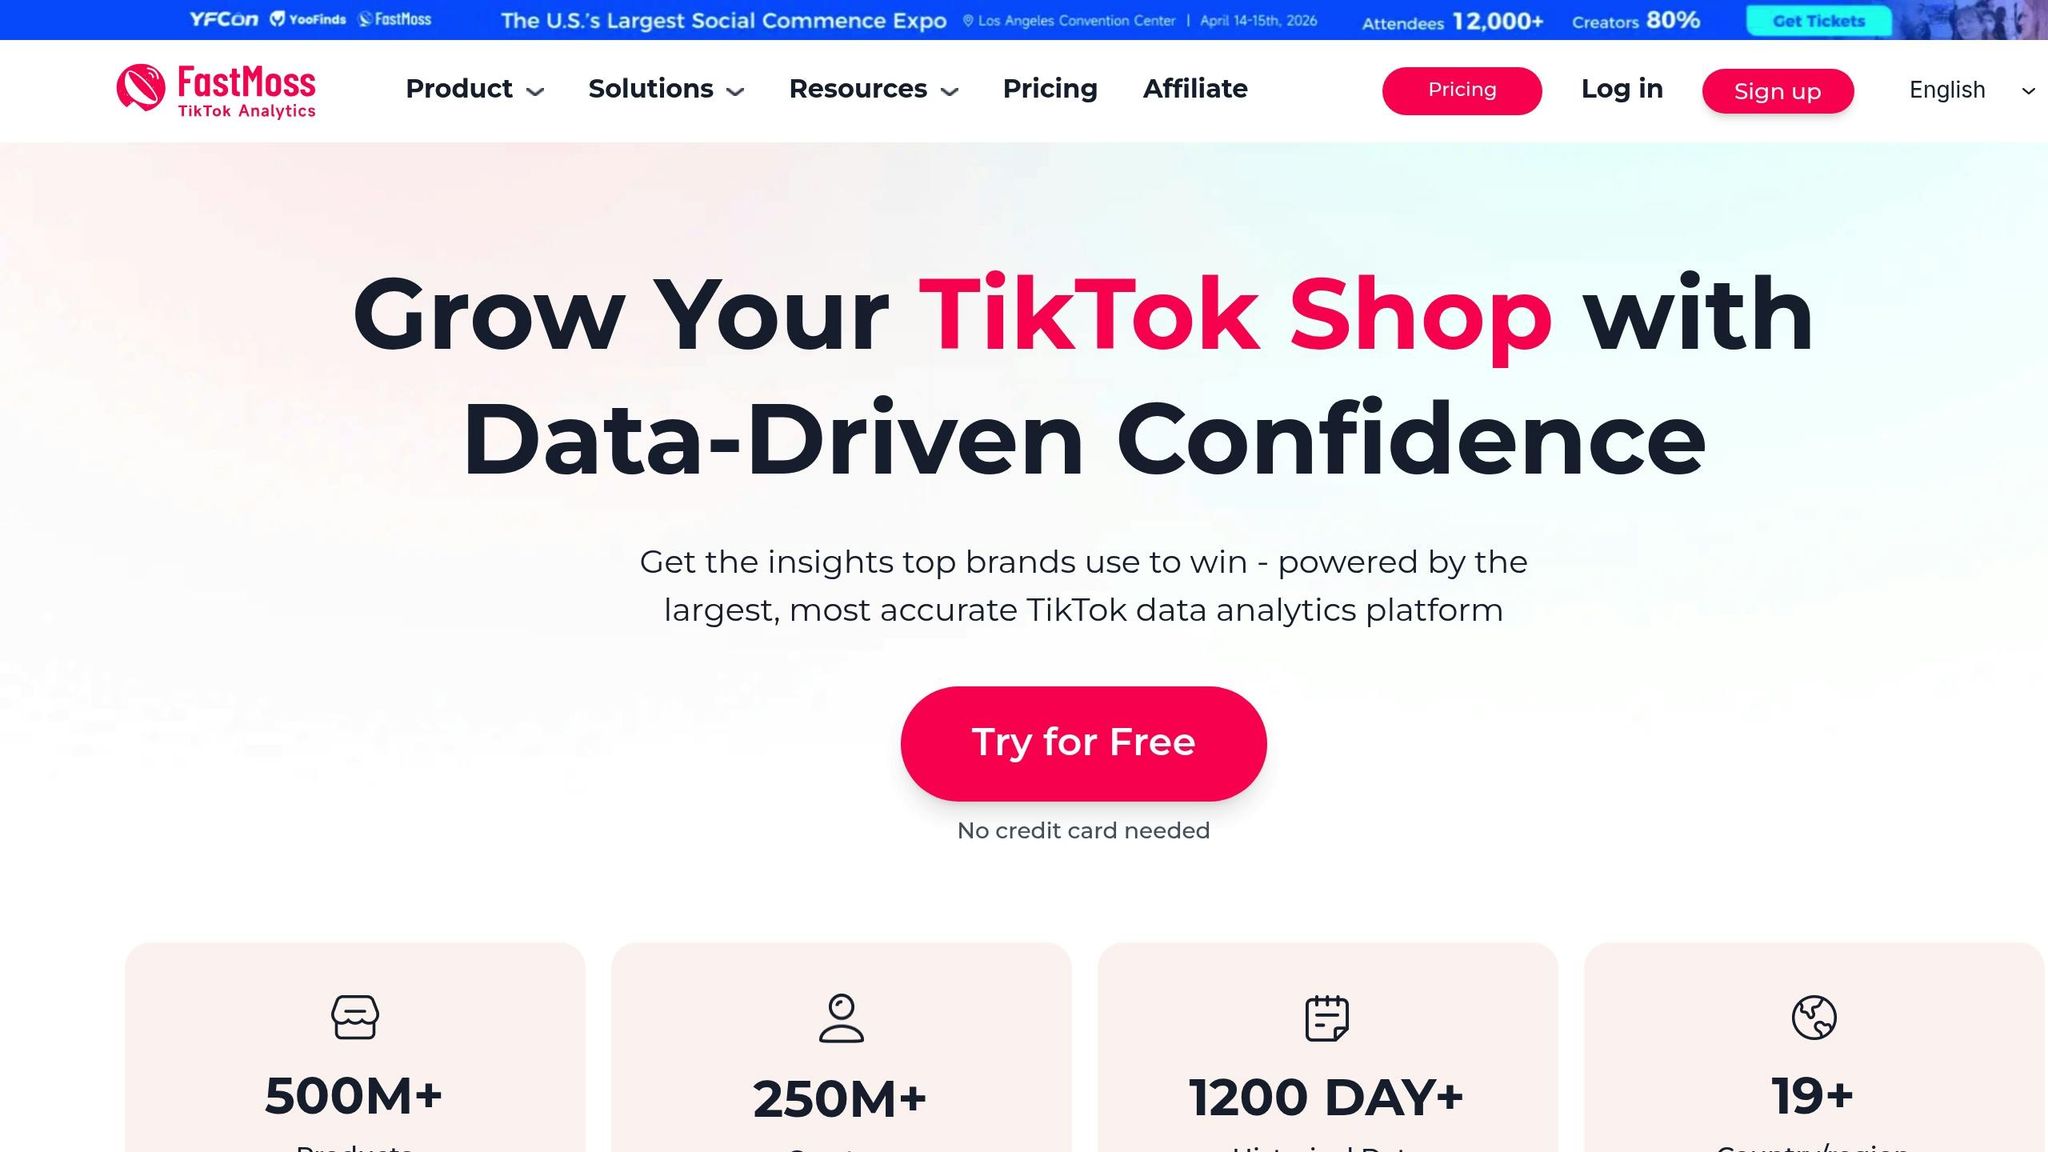
- FastMoss: Tracks over 500M products with detailed metrics like GMV, conversion rates, and audience insights. Offers dashboards for real-time updates and long-term trends.
- Conjura: Integrates TikTok Shop with platforms like Shopify and Amazon. Tracks profitability down to SKU-level, with AI-driven insights for smarter decisions.
- Exolyt: Specializes in TikTok social intelligence. Provides influencer analysis, audience demographics, and content performance insights.
Quick Comparison:
| Tool | Focus Areas | Cross-Platform Support | Pricing (Starting) |
|---|---|---|---|
| Emplicit | Multi-platform sales tracking, ROI | Yes | ~$200/month |
| Kalodata | TikTok Shop insights, trends | No | $16.90/month |
| FastMoss | TikTok Shop metrics, trends | No | $49/month |
| Conjura | Profitability, multi-channel data | Yes | Custom pricing |
| Exolyt | TikTok content and influencer data | No | $275/month |
Each tool offers unique features tailored to specific needs – whether you’re looking for cross-platform insights or TikTok-focused analytics. Choose the one that aligns with your goals to turn raw data into actionable strategies.
TikTok Shop Analytics Tools Comparison: Features, Pricing, and Platform Support
1. Emplicit
Cross-platform or Marketplace Integration
Emplicit brings together TikTok Shop metrics and performance data from major marketplaces like Amazon, Walmart, and Target, giving you a unified sales snapshot. This consolidated view simplifies performance tracking across multiple platforms, making it easier to pinpoint which channels are driving the best results.
Sales Tracking and Performance Metrics
With this integrated approach, Emplicit provides real-time tracking of sales and ad spend. By measuring ROI and analyzing SKU-level performance, it reveals which products are directly boosting revenue on TikTok Shop. This data serves as a key resource for shaping smarter marketing strategies.
Visualization Features (Charts, Dashboards, Trends)
Emplicit’s tailored dashboards transform complex data into clear, actionable insights. They highlight organic growth trends and advertising performance in real time, helping you fine-tune inventory levels and pricing strategies with confidence.
2. Kalodata
Sales Tracking and Performance Metrics
Kalodata keeps tabs on an impressive 200 million products, offering critical insights like total revenue, best-sellers, and average prices. It goes a step further by tracking product launch dates, quantities sold, and trending statuses, helping businesses spot growth opportunities. With 1,000 days of historical data at your fingertips, you can dive into long-term trends and fine-tune your seasonal strategies based on real performance patterns. The platform also delivers detailed ROI analyses to help you make the most of your ad budget and offers insights to improve marketing efficiency. These metrics form a solid foundation for understanding your audience and identifying emerging trends.
Audience Insights and Demographics
Kalodata analyzes 250 million TikTok creators and over 400 million videos and livestreams to pinpoint influencers whose audiences match your target market. This makes it easier to evaluate potential collaborators by reviewing their historical sales performance and promotional methods, ensuring you connect with creators who excel in your product niche. Adding to its credibility, Kalodata’s team includes former members of TikTok’s global e-commerce division, bringing insider knowledge to its audience analysis tools. These insights are presented through user-friendly visual dashboards, making data actionable and easy to understand.
Visualization Features (Charts, Dashboards, Trends)
Kalodata’s centralized dashboard simplifies data exploration. The "Explore" section showcases trending products, influential creators, popular videos, and standout livestreams. A side panel allows you to filter by category, offering metrics like revenue and sales performance. The "Follow" feature within Shop Insights lets you track specific competitors, keeping you updated on their best-sellers and revenue changes. Trend analysis tools highlight which products, video formats, and livestream designs are driving sales, giving you a clear picture of what works on TikTok.
Cross-Platform or Marketplace Integration
Kalodata focuses exclusively on TikTok Shop data, offering subscription plans ranging from $38.30 to $75.00 per month, with a 7-day free trial. It’s designed for sellers, brands, creators, and affiliates who want in-depth TikTok Shop insights. By zeroing in on TikTok Shop visualization, Kalodata supports a data-driven approach to decision-making, tailored specifically for this platform.
3. FastMoss
Sales Tracking and Performance Metrics
FastMoss keeps tabs on over 500 million products, offering shop-level insights like total units sold, GMV (Gross Merchandise Value), national rankings, and ratings. It dives deep into product-level data with 28-day analytics, covering units sold, GMV, historical listings, and commission ranges. Advertising performance is also tracked, with metrics such as views, conversion rates, spend, ROAS (Return on Ad Spend), and ROI. Plus, the platform provides 1,200 days of historical data, giving you the ability to analyze long-term trends.
Operational performance is just as important. FastMoss visualizes key metrics like quality scores, positive rating percentages, response times (within 24 hours), and shipping speeds (within 48 hours). For livestreams, it tracks total units sold, average viewers per session, and GMV per session. Video metrics include views, likes, and units sold. The platform even monitors affiliate performance, showcasing influencer-driven sales, revenue, and the number of new influencers joining your shop’s network. For instance, the shop "bestbuystationery" achieved 33,400 units sold and $2.3 million in GMV.
But FastMoss doesn’t stop at sales – it also delivers robust audience insights.
Audience Insights and Demographics
Using AI-driven "Voice of the Customer" tools, FastMoss analyzes product reviews to uncover consumer sentiment and preferences. It tracks data for 250 million creators across 19+ countries and regions, helping you find influencers whose followers align with your target audience. By monitoring growth ranks and follower increases, you can identify up-and-coming creators who are effectively reaching new audiences. Clark Jeoun, TikTok Shop Affiliate Manager at Mixsoon, shared:
It helps us reach more creators and connect with a much wider audience of customers.
The platform’s Market 360 and Category Insights features complement these tools by revealing national-level trends and broader consumer behaviors. For advertising, FastMoss tracks engagement rates and impressions for top-performing campaigns, providing insights into what resonates with specific viewer segments. This alignment between creators and audiences makes affiliate marketing more impactful and helps you connect with the right customers.
Visualization Features (Charts, Dashboards, Trends)
FastMoss offers specialized dashboards for Market 360, Products, Creators, Shops, LIVE & Video, Ads, and Agencies. Real-time updates mean you can monitor live streams, video performance, and GMV changes as they happen. Historical data allows you to track trends in hashtags, music, and ad creatives over time. The Ad Performance Composition feature visualizes key metrics like views, conversion rates, spend percentages, and ROAS, helping you benchmark successful strategies.
Ranking tools highlight top-selling products, fastest-growing shops, and top-performing creators based on GMV and sales volume. Alex Elsea, Founder & CEO of Mixsoon, noted:
FastMoss has been absolutely essential. I genuinely use it all the time – it’s hard to imagine running our operations without a tool like this.
The "Find Ads" feature lets you discover top-performing ad videos in your category and analyze their creative strategies. With over 3.2 million users, FastMoss has earned "Top Performer" recognition for Winter 2024 and 2025.
Cross-Platform or Marketplace Integration
FastMoss focuses exclusively on TikTok Shop analytics across 19+ countries and regions. Pricing begins at $49 per month for the Basic plan, which includes 90-day historical data and 150 detail page views daily. The Pro plan, at $89 per month, offers 180-day data, 300 daily views, and affiliate outreach automation. For $139 per month, the Ultimate plan provides 1,200-day historical data and unlimited detail page views. Enterprise plans are available with custom pricing, offering API integration and tailored data exports. A 7-day free trial is also available, no credit card required.
4. Conjura
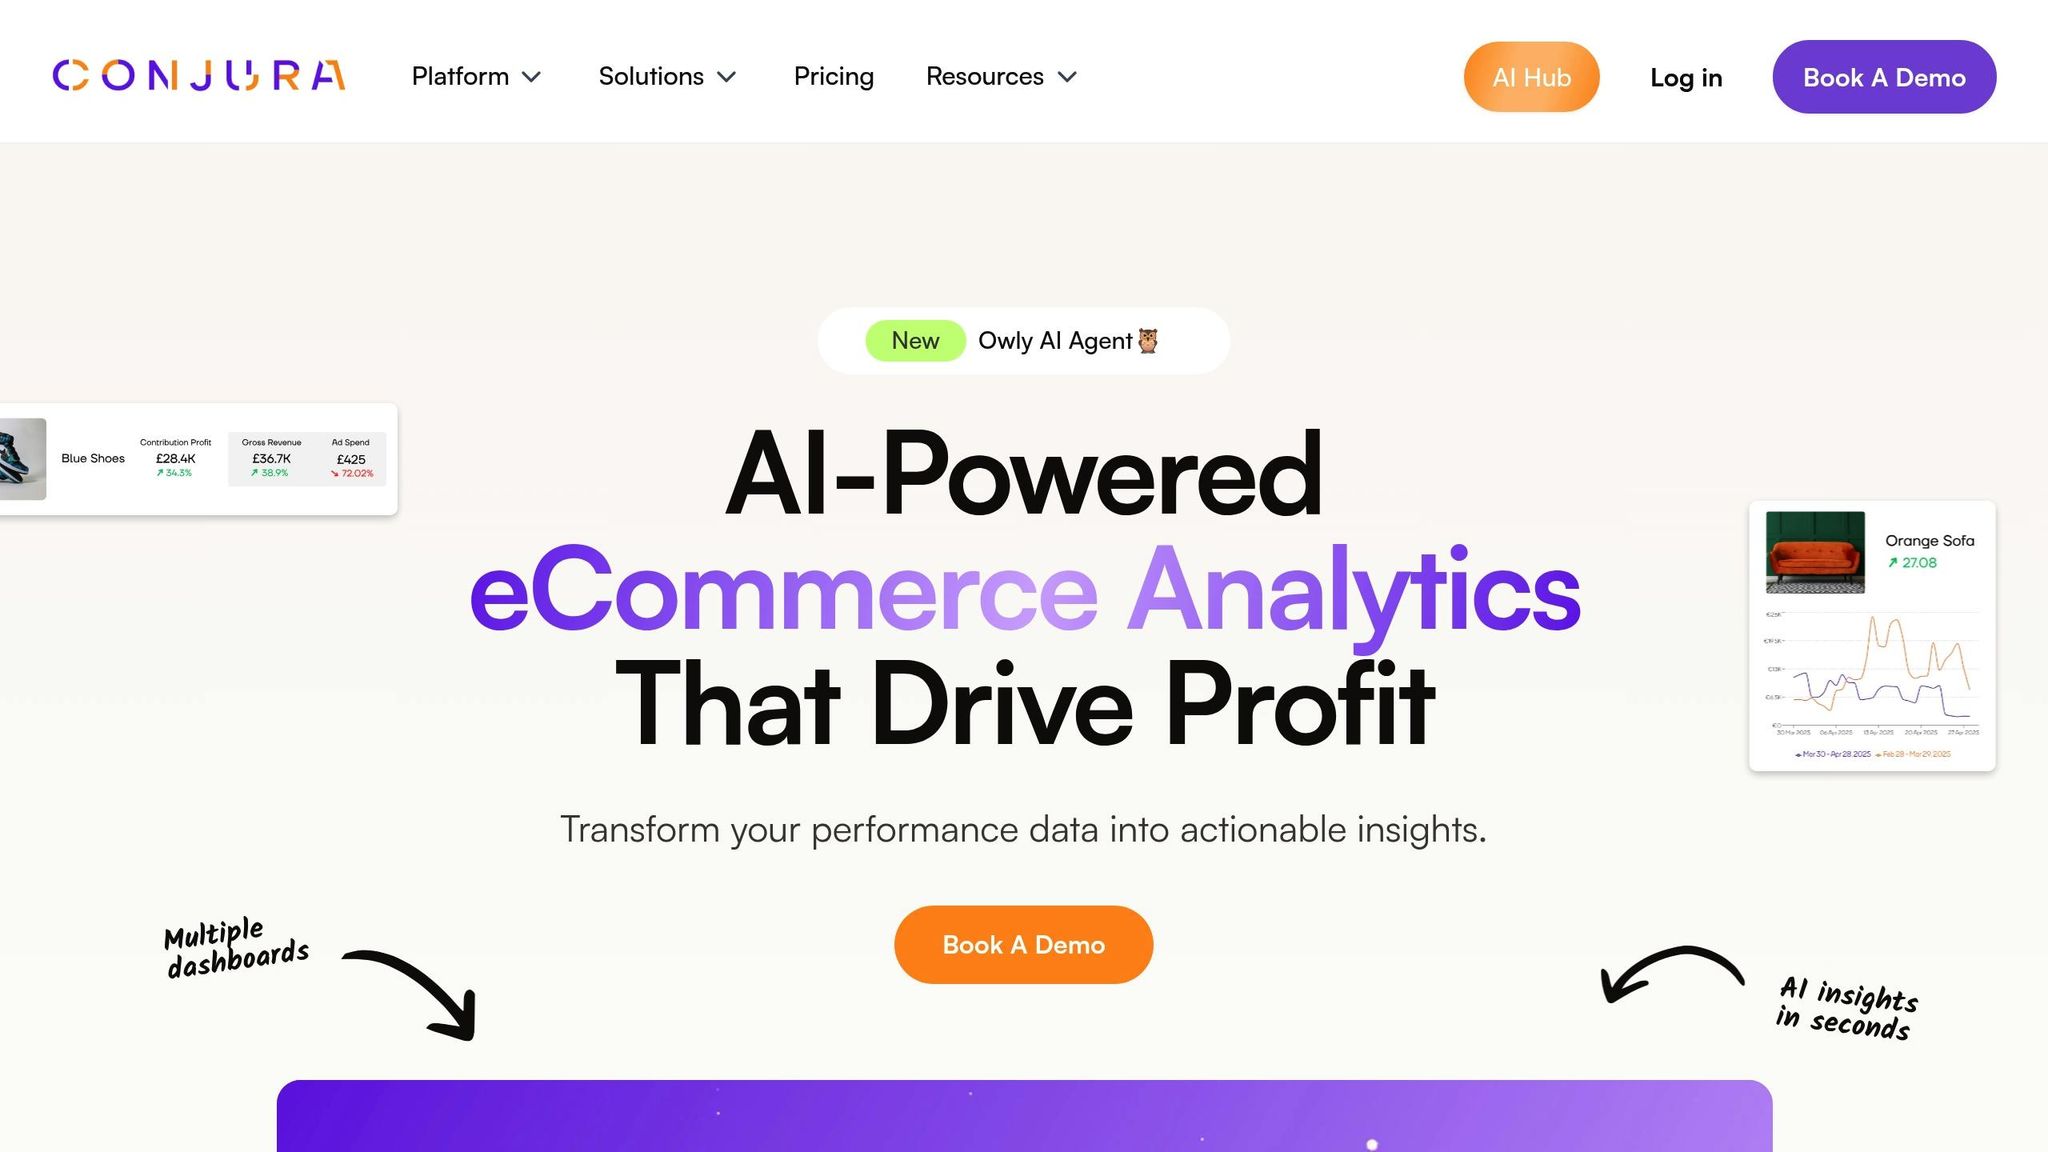
Sales Tracking and Performance Metrics
Conjura stands out by linking spending directly to product performance. It tracks SKU-level ad spend attribution across platforms like TikTok, Meta, and Google, helping you pinpoint which products are delivering results. By factoring in ad spend, fees, fulfillment costs, and refunds per SKU, Conjura calculates Contribution Profit, offering precise insights into profitability.
The platform also monitors long-term customer health metrics for TikTok Shop, including Customer Lifetime Value (LTV), Customer Acquisition Cost (CAC), repeat purchase rates, and order frequency. For instance, Furniturebox used Conjura to shift their focus from revenue to profit optimization, resulting in a 23% year-over-year increase in contribution profit. Marketing Director Kayla Wilson shared:
I’m a big fan of Conjura and there’s so much more for us to keep getting from it.
In addition to profitability metrics, Conjura provides detailed audience analysis tools.
Audience Insights and Demographics
Conjura’s Owly AI Agent allows users to ask performance-related questions in plain English – like "Which TikTok campaigns are losing money?" – and instantly receive strategic recommendations and automated reports. The AI assistant also uncovers "hidden stars", identifying SKUs that drive cross-product revenue or engagement. Helena Dingley, Senior eCommerce Director at Ella & Jo, praised the tool:
It’s very powerful! We’ve been looking for a tool like this for a while, it’s going to transform our business.
This feature also enables side-by-side comparisons of different channels, helping businesses understand which platforms attract the most valuable customers.
Visualization Features (Charts, Dashboards, Trends)
Conjura offers a unified dashboard that merges TikTok Shop and TikTok Ads data with platforms like Shopify, Amazon, Walmart, and eBay. This eliminates data silos, making insights more actionable. Users can explore pre-saved views such as Performance Trends, Campaign Deepdive, Purchase Patterns, and Product Tables to analyze product-level performance and ad spend. TikTok Shop metrics can be visualized alongside other sales channels, making it easier to evaluate effectiveness.
The Owly AI feature takes it a step further by generating business reports – like investor decks or board summaries – based on natural language queries. This saves time and allows businesses to focus on high-level strategy.
Beyond its visualization capabilities, Conjura excels in integrating data across multiple platforms.
Cross-Platform or Marketplace Integration
Conjura integrates directly with TikTok Shop, TikTok Ads, Shopify, BigCommerce, Amazon Seller Central, Amazon Ads, Google Ads, Meta (Facebook/Instagram), and Microsoft Ads. This multi-channel approach provides detailed segmentation, helping businesses identify profit drivers and confidently adjust spending. With TikTok Shop generating over $20 billion in GMV in 2023 and projections to double year-over-year, having a unified view of all sales channels is crucial for making informed decisions.
sbb-itb-e2944f4
5. Exolyt
Audience Insights and Demographics
Exolyt specializes in TikTok social intelligence, offering detailed insights into audience demographics like age, gender, and location. Its AI-powered sentiment analysis uncovers authentic audience opinions, helping TikTok Shop sellers pinpoint which customer segments are the most engaged and why.
The platform also shines when it comes to influencer discovery and evaluation. You can find niche influencers by country and assess their performance metrics before deciding to collaborate. Corey Kleinsasser, Marketing and Social Media Director, shared his thoughts on the tool:
Exolyt has been EXTREMELY helpful in showing all of the creator collaborations we have worked on… Now, we can easily track and view all creator content and build new collaborations to reach new audiences.
In addition to audience analysis, Exolyt offers competitive intelligence by letting users monitor competitor accounts. This includes exploring their audience interactions to uncover potential market gaps. These insights are presented through dynamic visualization tools, making the data easier to interpret and act upon.
Visualization Features (Charts, Dashboards, Trends)
Exolyt provides interactive dashboards that track daily performance metrics for accounts, videos, and hashtags. It also includes user-friendly graphs that highlight trends, such as audio popularity, allowing users to identify viral sounds before they become oversaturated.
For more advanced reporting, Exolyt integrates with Google Data Studio via Google Sheets, enabling automated custom reports that update around the clock. Users also receive a daily curated list of the top-performing hashtags, complete with metrics like total views and average views per video. Pricing begins at $330 per month (billed annually), with a free plan available for basic functionality. These visual tools focus on content engagement, while the platform’s integration capabilities allow for data export and tailored analytics.
Cross-Platform or Marketplace Integration
Exolyt is solely dedicated to TikTok social intelligence and does not handle backend e-commerce logistics. It doesn’t offer native integrations for sales data from platforms like Amazon or Shopify. However, it supports data export via CSV files and Google Sheets integration, enabling users to manually merge TikTok metrics with other data sources. This makes Exolyt ideal for evaluating content performance and influencer impact, though additional tools are necessary for tracking sales and profitability. By combining in-depth social insights with strong visualization tools, Exolyt helps users make strategic decisions for their TikTok Shops.
Best TikTok Shop Tool for 2026 Revealed
Tool Comparison Table
Choose the right analytics tool based on what matters most to your business – whether it’s tracking profits, gaining competitive insights, or managing cross-channel visibility. The table below highlights the core strengths of each tool, making it easier to compare their features.
| Tool | Sales Tracking Focus | Audience Insights | Visualization Options | Cross-Platform Support |
|---|---|---|---|---|
| Emplicit | ROI measurement and conversion tracking | Demographics, behavior, and sentiment analysis | Customizable dashboards for social performance | Extensive (supports TikTok, Instagram, Facebook, Twitter) |
| Kalodata | GMV tracking, ROI analysis, and 1,000-day history | Access to over 250M creator and livestream data | Trending charts and competitor benchmarks | Limited (Primarily focused on TikTok Shops) |
| FastMoss | High-volume sales trends and batch data export | Market and product trend tracking | Side-by-side product performance comparisons | Limited (TikTok-centric) |
| Conjura | SKU-level profit analysis, TACoS, and real-time P&L | LTV, CAC, and repeat purchase behavior | AI-powered dashboards featuring Owly AI | Extensive (integrates with Shopify, Amazon, Walmart, eBay, Meta, Google) |
| Exolyt | Engagement-driven sales insights and influencer ROI | Follower growth, hashtag/sound analysis, and sentiment analysis | Deep content performance and viral trend insights | Limited (Specialized for TikTok) |
If you’re looking for tools that work across multiple platforms, Emplicit and Conjura are excellent choices. Conjura stands out for its SKU-level metrics and advanced AI-powered dashboards, offering detailed insights into profitability across various channels. On the other hand, Kalodata, FastMoss, and Exolyt are ideal for those focusing on TikTok, with Exolyt excelling in influencer ROI and sentiment analysis, while Kalodata provides extensive historical data.
Pricing varies significantly among these tools. Kalodata starts at $16.90/month, making it an affordable option for TikTok-focused analytics. Emplicit’s Essential plan is around $200/month, and Exolyt’s Essentials package is priced at approximately $275/month. For Conjura, pricing is customized and available upon request through a demo.
Conclusion
Selecting the best analytics tool for your TikTok Shop depends on where your business stands and the challenges you’re facing. For example, Emplicit excels in cross-platform analytics and ROI tracking, while Kalodata and FastMoss focus on market trends and identifying top-performing creators. If you’re looking for detailed content performance insights, Exolyt is a strong choice. On the other hand, Conjura specializes in SKU-level profit tracking and operational insights powered by AI. These tools cater to the diverse needs of a rapidly growing TikTok Shop ecosystem.
With nearly 58% of users now making purchases directly through TikTok and global GMV expected to hit $66 billion by 2025, data visualization has become a must for scaling operations. The shift from chasing viral trends to focusing on operational efficiency means businesses need to track metrics that directly impact profitability – like Total Advertising Cost of Sales (TACoS), shipping fees, and affiliate commission adjustments.
Take the time to audit your data streams. For example, hidden shipping fees and excess affiliate commissions on returns can quietly eat into your profits. Tools like Conjura can automatically flag these issues, while Kalodata provides a straightforward way to stay on top of market trends. By addressing these gaps, you can make smarter, data-driven decisions that protect your bottom line. And remember, the analytics tool you choose should integrate with real financial data rather than relying on estimates from public profiles.
Ultimately, the right analytics platform turns raw data into actionable insights. Whether you’re aiming to grow a six-figure business or managing a complex multi-channel operation, investing in a strong data visualization tool is crucial. It ensures you’re making informed decisions and avoiding costly mistakes as your TikTok Shop continues to expand.
FAQs
What should I consider when choosing a TikTok Shop data visualization tool?
When choosing a TikTok Shop data visualization tool, start by identifying your main objectives – whether it’s monitoring sales, analyzing audience behavior, or evaluating profitability. The right tool should align with your goals and offer features like real-time data updates, intuitive dashboards, and in-depth performance metrics.
For profitability tracking, opt for a tool that factors in expenses to give a clear picture of your earnings. If you’re looking for a broader perspective, consider tools that integrate sales data with audience trends or influencer performance. Let your budget, the level of detail you need, and your business priorities guide your selection.
What are the key features of tools for analyzing TikTok Shop performance?
When it comes to analyzing TikTok Shop performance, there’s no one-size-fits-all solution. Different tools are tailored to meet specific business needs, offering features that help brands stay ahead in this fast-paced marketplace.
Some tools emphasize data integration and automation, making it easier for businesses to gather and process sales, customer, and operational data without getting bogged down in manual work. Others zero in on SKU-level ad spend tracking, allowing brands to connect ad performance directly to sales and uncover trends across various channels.
For those focusing on content and influencer partnerships, certain platforms provide insights into creator collaborations, competitor activities, and even livestream trends. These features help brands fine-tune their strategies and stay competitive. TikTok’s in-house tools, like LIVE Analytics and Seller Center dashboards, are especially handy, offering real-time metrics on everything from livestream engagement to account health. This instant feedback empowers sellers to make quick, informed decisions.
Whether you’re diving into detailed performance tracking or refining your content and advertising strategies, these tools provide the support businesses need to manage and grow their TikTok Shops effectively.
Why is it important to integrate multiple platforms for TikTok Shop analytics?
Using multiple platforms for TikTok Shop analytics is key to getting a full picture of your business performance. If you rely on just one data source, you might miss important insights, making it tougher to track metrics like sales, customer behavior, or the success of your marketing efforts.
When you bring together data from different tools – like TikTok’s API, analytics platforms, and marketplace management systems – you can centralize critical metrics such as sales trends, audience engagement, and inventory performance. This approach not only cuts down on the time spent manually gathering data but also allows you to make quicker, data-backed decisions. These decisions can help refine your marketing strategies and drive business growth. Plus, integrating platforms ensures you’re using real-time insights to keep pace in the ever-changing TikTok shopping landscape.