Tracking Amazon PPC metrics is the key to running profitable ad campaigns. Without monitoring, you risk overspending without driving meaningful results. Here’s the deal:
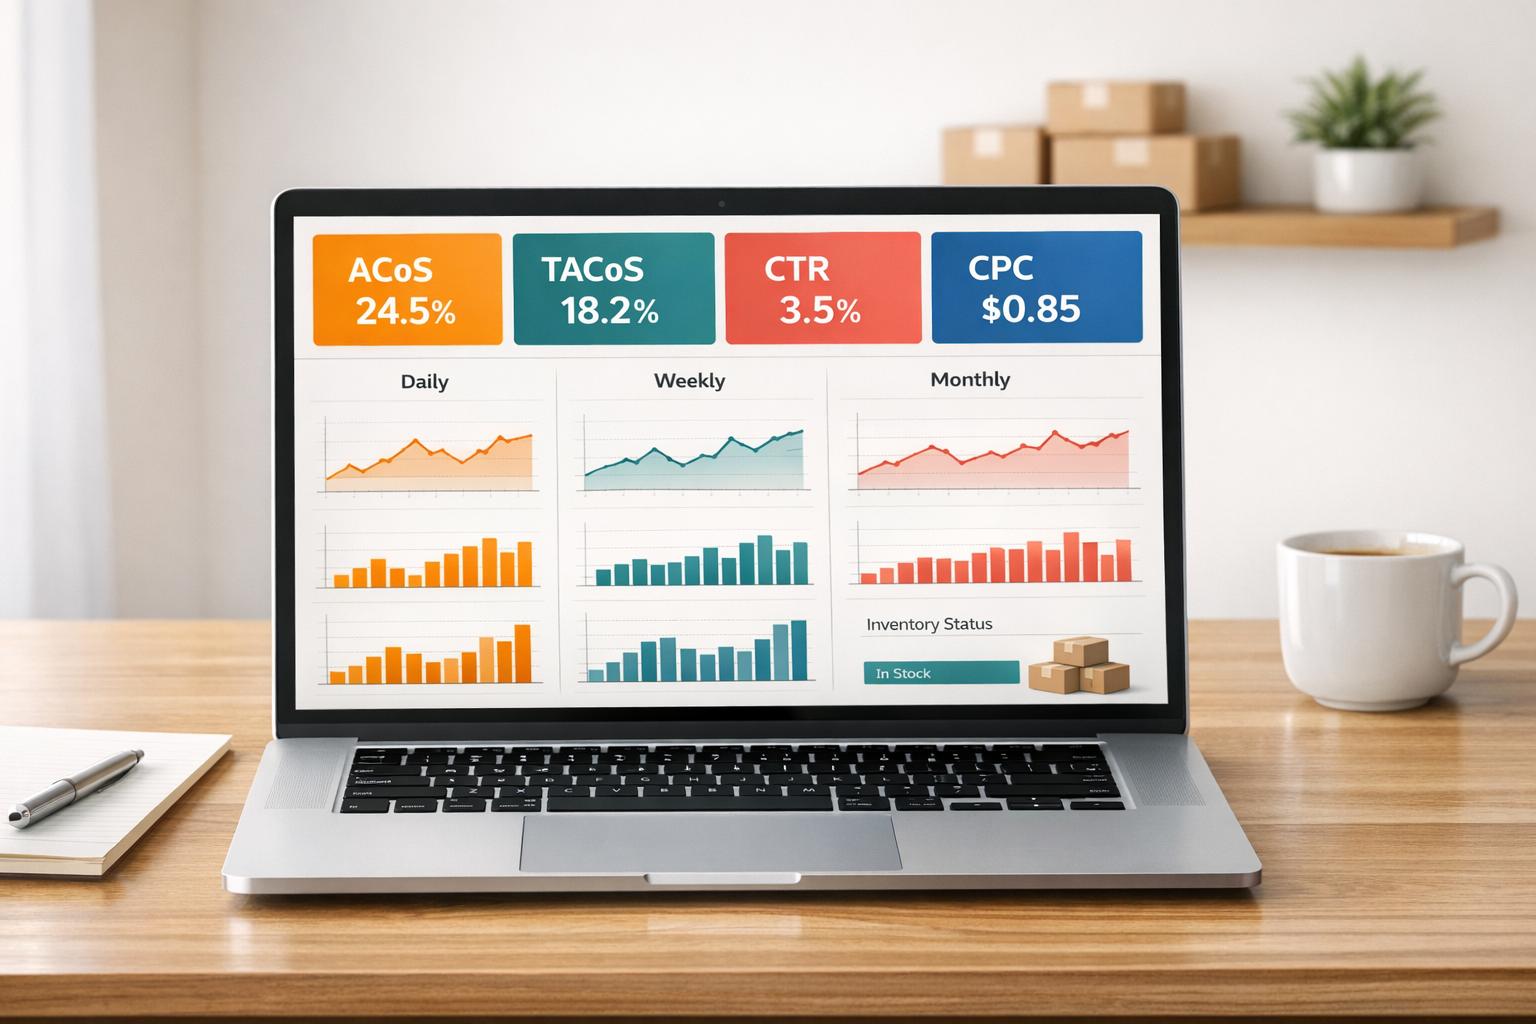
- Amazon PPC charges for clicks, not impressions. Success depends on metrics like ACoS, ROAS, CTR, and CPC.
- In 2026, average CPC ranges from $1.00–$1.05, with ACoS hovering at 32–35%. However, costs vary by category, making tracking more important than ever.
- Rising CPCs (+10–15% since 2025) and Amazon’s AI assistant, Rufus, influencing 40% of purchases by late 2026, mean staying competitive requires daily, weekly, and monthly metric reviews.
Key Takeaways:
- Daily: Monitor budgets, inventory (pause campaigns for low stock), and keyword indexing.
- Weekly: Review search terms, cut waste, and reallocate budgets toward high-performing campaigns.
- Monthly: Analyze TACoS and profitability, ensuring ads grow your business instead of replacing organic traffic.
Metrics like TACoS, placement performance, and new-to-brand orders help refine strategies. Automating tracking with tools or professionals ensures accuracy and saves time. Ignoring these metrics could lead to wasted ad spend and declining organic rankings.
Let’s dive deeper into how to track, analyze, and optimize these metrics effectively.
7 Best Amazon PPC Metrics to Track for Increased Sales and Profitability
sbb-itb-e2944f4
Metrics to Track Daily, Weekly, and Monthly
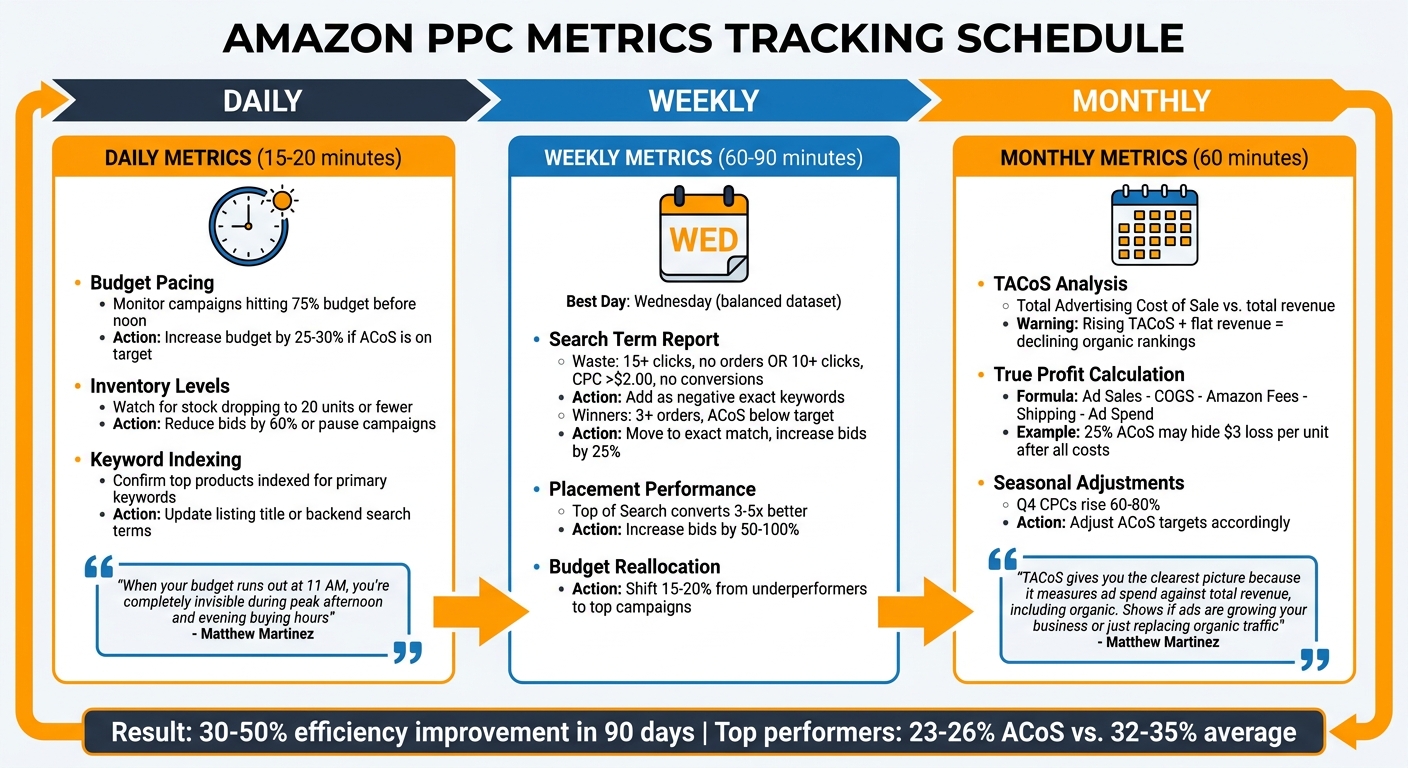
Amazon PPC Metrics Tracking Schedule: Daily, Weekly, and Monthly Tasks
Keeping an eye on metrics at the right intervals helps you avoid hasty decisions while staying agile enough to address issues before they spiral out of control. Daily tracking ensures campaigns remain visible and budgets stay in check. Weekly reviews help refine profitability. Monthly analysis uncovers whether your advertising efforts are driving true growth or merely substituting for organic sales.
Daily Metrics: Visibility and Spending Oversight
Spend about 15–20 minutes each day reviewing budget pacing, inventory levels, and keyword indexing. Watch for campaigns that hit 75% of their budget before noon. If a campaign is burning through its budget early but maintaining an ACoS at or below your target, increase the daily budget by 25–30% on the spot. Matthew Martinez, Senior Brand Manager at Sequence Marketing Agency, highlights the risks of running out of budget too soon:
When your budget runs out at 11 AM, you’re completely invisible during peak afternoon and evening buying hours.
Next, keep tabs on inventory. If stock drops to 20 units or fewer, reduce bids by 60% or pause the campaigns altogether. Advertising low-stock items often leads to wasted spending, as "Only 3 left" alerts can deter conversions. Lastly, confirm that your top-performing products remain indexed for their primary keywords. If they’re not, update your listing title or backend search terms immediately.
Daily checks set the stage for immediate control, while weekly reviews help you optimize for profitability.
Weekly Metrics: Profitability and Revenue Focus
Midweek – especially Wednesday – is the best time for a deeper review, as it provides a balanced dataset from the weekend and early week. Start by downloading your weekly Search Term Report to identify "waste" and "winners". Waste includes terms with 15+ clicks and no orders, or 10+ clicks with a CPC over $2.00 and no conversions. Add these as negative exact keywords right away.
Winners, on the other hand, are search terms generating 3+ orders with an ACoS below your target. Transfer these terms into dedicated exact match campaigns and increase bids by 25% over the current rate. This is also the time to check the Placements tab – Top of Search placements often convert 3–5 times better than Product Pages, which justifies increasing bids by 50% to 100% for these spots. To boost efficiency without raising your budget, reallocate 15–20% of your daily budget from underperforming campaigns to your best-performing ones. Use total sales divided by total spend to identify which campaigns deserve more funding.
Weekly adjustments fine-tune performance, while monthly reviews focus on the bigger picture.
Monthly Metrics: Strategic Insights and Adjustments
Monthly reviews are all about long-term strategy. Pay close attention to TACoS (Total Advertising Cost of Sale), which measures ad spend as a percentage of total revenue, including organic sales. As Matthew Martinez explains:
TACoS gives you the clearest picture because it measures ad spend against total revenue, including organic. Shows if ads are growing your business or just replacing organic traffic.
If TACoS is climbing but total revenue remains flat, it could indicate that your organic rankings are slipping, with ads compensating for the lost traffic. This is a warning sign. To get a true sense of profitability, calculate your True Profit by subtracting COGS, Amazon fees, and shipping costs from your ad sales, then subtracting your ad spend. For example, a campaign with a 25% ACoS might seem profitable, but after factoring in $12 COGS and $8 in fees, you could actually be losing $3 per unit. Monthly reviews also allow you to prepare for seasonal trends – Q4 CPCs often rise by 60–80%, so adjust your ACoS targets accordingly.
Advanced Metrics for Better Analysis
Once you’ve established a rhythm with daily, weekly, and monthly reviews, diving into advanced metrics can give you a sharper view of your campaign’s performance.
Search Query and Attribution Metrics
Search Term Reports are a goldmine for understanding the exact phrases customers use before clicking your ads. These phrases often differ from the keywords you bid on. For example, a broad match keyword like "coffee maker" might trigger searches such as "best drip coffee maker under $50." This insight allows you to fine-tune your bids. By identifying terms that generate 8 or more orders in broad or phrase match campaigns, you can shift these to exact match campaigns with similar bid strategies for better results.
It’s important to note that attribution windows vary: Sponsored Products use a 7-day window, while Sponsored Brands and Sponsored Display rely on a 14-day window. This means you should wait for the full attribution period before making bid adjustments, as conversion data can shift during this time. As Ad Badger puts it:
Attribution is not about finding the ‘perfect’ number, because that number doesn’t exist. It is about understanding the narrative behind the numbers.
To avoid premature changes, give your campaigns the full 14 days to settle before evaluating performance. Additionally, keep an eye on the Brand Halo Effect, where a customer clicks on an ad for one product but ends up buying another from your brand. Regularly check your "Purchased Product" reports to ensure your ads aren’t unintentionally driving sales of lower-margin items.
These insights into search queries naturally lead into how product-level data can further refine your campaign strategies.
Product-Level and Placement Metrics
Digging into placement performance can reveal game-changing insights. For instance, the Placement Report shows where your ads appear and how they perform. Typically, Top of Search placements deliver much stronger results than others. If this placement consistently outperforms, consider increasing bids by 50% to 100%. On the flip side, Product Pages often have the lowest conversion rates, so reducing bids by 30% to 50% or even pausing these placements might be a wise move.
Here’s a quick breakdown:
| Placement | Typical Performance Pattern | Action |
|---|---|---|
| Top of Search | Converts 3–5x better than other spots | Increase bids by 50% to 100% |
| Rest of Search | Moderate performance | Adjust bids between 0% and 20% |
| Product Pages | Typically the weakest performance | Decrease bids by 30% to 50% or pause |
At the product level, metrics can also reveal which ASINs are driving purchases after a click. A critical point to monitor is inventory. If a single variation within a parent–child ASIN goes out of stock, the entire listing’s conversion rate can take a nosedive, while your ads keep spending. To avoid unnecessary costs, reduce bids by 60% or pause campaigns altogether when inventory drops below 20 units. Lastly, New-to-Brand (NTB) metrics are invaluable for tracking how many of your orders come from first-time customers, helping you gauge your customer acquisition efforts.
How to Set Up and Automate Metrics Tracking
Tracking Metrics in Amazon Ads Console
To monitor your campaign performance, start with the "Reports" menu in the Amazon Ads Console. You have three options for tracking metrics: the interactive console, downloadable CSV reports, or the Amazon Advertising API. The interactive console allows for quick adjustments to bids and budgets, while CSV reports provide detailed insights, such as how different ad placements are performing.
For deeper analysis, use the Search Term Report to identify customer queries that led to ad clicks. The Placement Report helps you evaluate how ads perform in various locations, like "Top of Search" versus "Product Pages", so you can fine-tune placement bids. The Advertised Product Report is essential for spotting underperforming ASINs that drain your budget without delivering sales. To stay proactive, consider setting up email alerts to prevent campaigns from pausing unexpectedly.
By 2026, the console has expanded its reporting capabilities across Sponsored Products, Brands, and Display ads. New additions include categories like Gross and Invalid Traffic, and a "Prompts" report, which tracks performance for Rufus, Amazon’s AI shopping assistant. A PPC Ninja expert describes the current reporting landscape:
What used to be a 10-minute weekly download is now a complex reporting ecosystem. Most advertisers are either overwhelmed and ignore reports entirely, or they download everything and drown in data.
Once you’ve established a manual reporting process, it’s time to shift gears and explore automation for more scalable and efficient tracking.
Automating Metrics Tracking with Tools and Services
Manual tracking can quickly become a bottleneck as your campaigns grow. Automating metrics tracking not only saves time but also ensures accuracy. The Amazon Advertising API is a powerful tool for creating custom integrations that automate daily data downloads. For larger-scale analysis, Amazon Ads Data Manager allows you to link advertising data directly to data warehouses like Amazon S3 or Redshift. However, keep in mind that when connecting external tools via API, Amazon often limits historical data syncing to the past three months.
Third-party tools can simplify this process by combining automated reporting with features like bid optimization and profit analysis. These tools consolidate metrics such as ACoS, CPC, and Cost per Order with your overall profit and loss data, offering a comprehensive view of campaign performance. For businesses managing campaigns across multiple platforms, Emplicit‘s PPC management services provide end-to-end support. Their USA-based account managers handle everything from automated reporting to strategic bid adjustments, enabling brands to scale efficiently on platforms like Amazon, Walmart, and Target.
To streamline your workflow, set up a weekly automation process that reviews the past 14 days of data. Focus on search terms generating 10+ clicks without orders (add these as negatives) and terms with 3+ orders and a low ACoS (harvest these as new keywords). For long-term improvements, automate monthly reviews of the Advertised Product and Placement reports to identify underperformers and adjust placement bid modifiers. When working with Sponsored Display metrics, always separate click-based orders from total orders to avoid skewed performance metrics caused by view-through attribution.
Using Metrics to Improve Campaign Performance
Daily, Weekly, and Monthly Optimization Schedule
To get the most out of your campaigns, it’s important to turn your metric tracking into actionable steps on a daily, weekly, and monthly basis. Here’s how you can break it down:
- Daily Tasks: Keep an eye on your budget and inventory. For example, if your campaign hits 75% of its daily budget before noon and still aligns with your target ACoS, increase the budget by 25–30% as suggested in the daily tracking section. On the inventory side, when stock drops to 20 units, consider reducing bids by 60% or pausing the campaign altogether.
- Weekly Reviews: Set aside time every seven days to assess performance using a 14-day rolling window. This approach accounts for Amazon’s 48–72 hour attribution delay, ensuring you don’t make decisions based on incomplete data. As Matthew Martinez, Senior Brand Manager at Sequence Marketing Agency, points out:
Amazon’s attribution means today’s clicks create sales over the next 7–14 days. Always look at a minimum 14‑day rolling window. Single-day decisions are garbage.
Use the Search Term Report during these reviews to identify which keywords are driving results and which are wasting your budget. Then, implement negative keywords or transfer high-performing terms to exact match campaigns as outlined in the weekly metrics section.
- Monthly Reviews: Dedicate about an hour each month to evaluate your TACoS (Total Advertising Cost of Sale) and overall profitability. This is the time to calculate your True Profit by factoring in ad spend, COGS, Amazon fees, and shipping costs. If your TACoS is climbing but your total sales remain flat, this could signal that you’re buying sales instead of fostering sustainable growth. Monthly reviews are also where you adjust for seasonal trends. For instance, during Q4 or major sales events, CPCs may spike by 60–80%, requiring temporary changes to your targets.
How to Adjust Bids and Add Negative Keywords
With your optimization schedule in place, the next step is fine-tuning your bidding and keyword strategy based on performance data.
- Bidding Adjustments: Use your breakeven ACoS as the benchmark for bid decisions. If your net profit margin after all costs is 30%, any campaign exceeding that ACoS is unprofitable. For keywords with high conversion rates but ACoS below your target, increase bids by 15–20%. On the flip side, reduce bids by 10–15% for keywords that are 5–15 percentage points above your target ACoS and add them to your negative keyword list.
- Placement Multipliers: Top of Search placements often deliver strong results, so applying a bid multiplier of +50% to +100% can be worthwhile. However, balance this by lowering your base keyword bid to keep costs under control.
- Negative Keywords: Add terms as negative exact matches if they rack up 15+ clicks without orders – or 10+ clicks with no orders and a CPC over $2.00. For broader underperforming patterns, negative phrase matching can help, but use negative broad matches sparingly to avoid cutting off relevant traffic.
- Reallocating Budget: Shift 15–20% of your daily budget from underperforming campaigns to those that are excelling. This adjustment should be made weekly to ensure your best campaigns are fully supported.
For campaigns that exceed your target ACoS by 15–25 percentage points, conduct a 48-hour review. Afterward, reduce the budget by 5–10% or pause the campaign entirely. If the overage is 25 percentage points or more, pause the campaign immediately and rebuild it with fresh targeting.
Conclusion
Tracking Amazon PPC metrics is what separates profitable campaigns from costly ones. With average CPCs projected to hit $1.00–$1.05 by early 2026 and competition heating up in every category, sticking to outdated strategies just won’t cut it anymore. Success now depends on consistent monitoring. This means daily checks for budget pacing and inventory (about 15–20 minutes), weekly reviews of search terms to cut waste (taking 60–90 minutes), and monthly profitability assessments that include costs like COGS, fees, and shipping.
By keeping a close eye on these metrics, campaign efficiency can improve by 30–50% in just 90 days. The best-performing campaigns tend to maintain an ACoS between 23–26%, compared to the broader average of 32–35%. But here’s the challenge: many brands simply don’t have the time or expertise to manage this level of optimization. That’s where experts come in. As Sequence Commerce explains:
Professional Amazon advertising management gets dedicated teams working on your campaigns daily. They implement optimizations from real-time data and deliver actual improvements.
For brands unable to commit the necessary resources, working with professionals can be a game-changer. Emplicit offers a full-service approach to marketplace management, combining PPC with listing optimization, inventory oversight, and strategic campaign design. Their "Diagnose, Design, Deploy, Dominate" framework has even helped some brands achieve revenue growth of 4x to 5x.
Whether you choose to handle daily metrics yourself or bring in experts, one thing is clear: rigorous tracking is non-negotiable for growth. Ignoring these metrics can lead to declining organic rankings and higher TACoS, ultimately stalling your campaign’s progress.
FAQs
What’s the difference between ACoS and TACoS?
The key distinction lies in what each metric evaluates. ACoS (Advertising Cost of Sale) measures ad spend as a percentage of sales directly attributed to ads. It’s all about understanding how much of your ad investment is driving revenue from those ads specifically.
On the other hand, TACoS (Total Advertising Cost of Sale) takes a wider perspective. It calculates ad spend as a percentage of your total revenue, factoring in both organic and paid sales. This gives insight into how your ad efforts contribute to overall business growth and long-term performance.
How do I find my breakeven ACoS for bidding decisions?
To figure out your breakeven ACoS, you’ll need to divide your product’s profit margin by its revenue. Let’s break it down with an example:
Imagine your product sells for $30. It costs you $10 to produce, and Amazon fees add up to $8. That leaves you with a profit of $12, which equals a 40% profit margin.
In this case, your breakeven ACoS is 40%. Any ACoS below this means you’re making a profit. To refine the calculation further, subtract all non-advertising costs to determine your exact profit margin.
When should I automate Amazon PPC reporting instead of doing it manually?
Managing multiple Amazon PPC campaigns can quickly become overwhelming, and that’s when automating your reporting becomes a game-changer. Automation not only saves time but also boosts accuracy and ensures you’re analyzing data right when you need it. It’s particularly helpful for keeping tabs on key metrics like impressions, CTR, ROAS, and conversion rates – especially when you’re working across multiple platforms. Relying on manual processes for this can lead to mistakes and inefficiencies.
By using tools like server-side tracking and centralized data solutions, you can streamline your reporting process, making it much easier to manage performance effectively and stay on top of your campaigns.