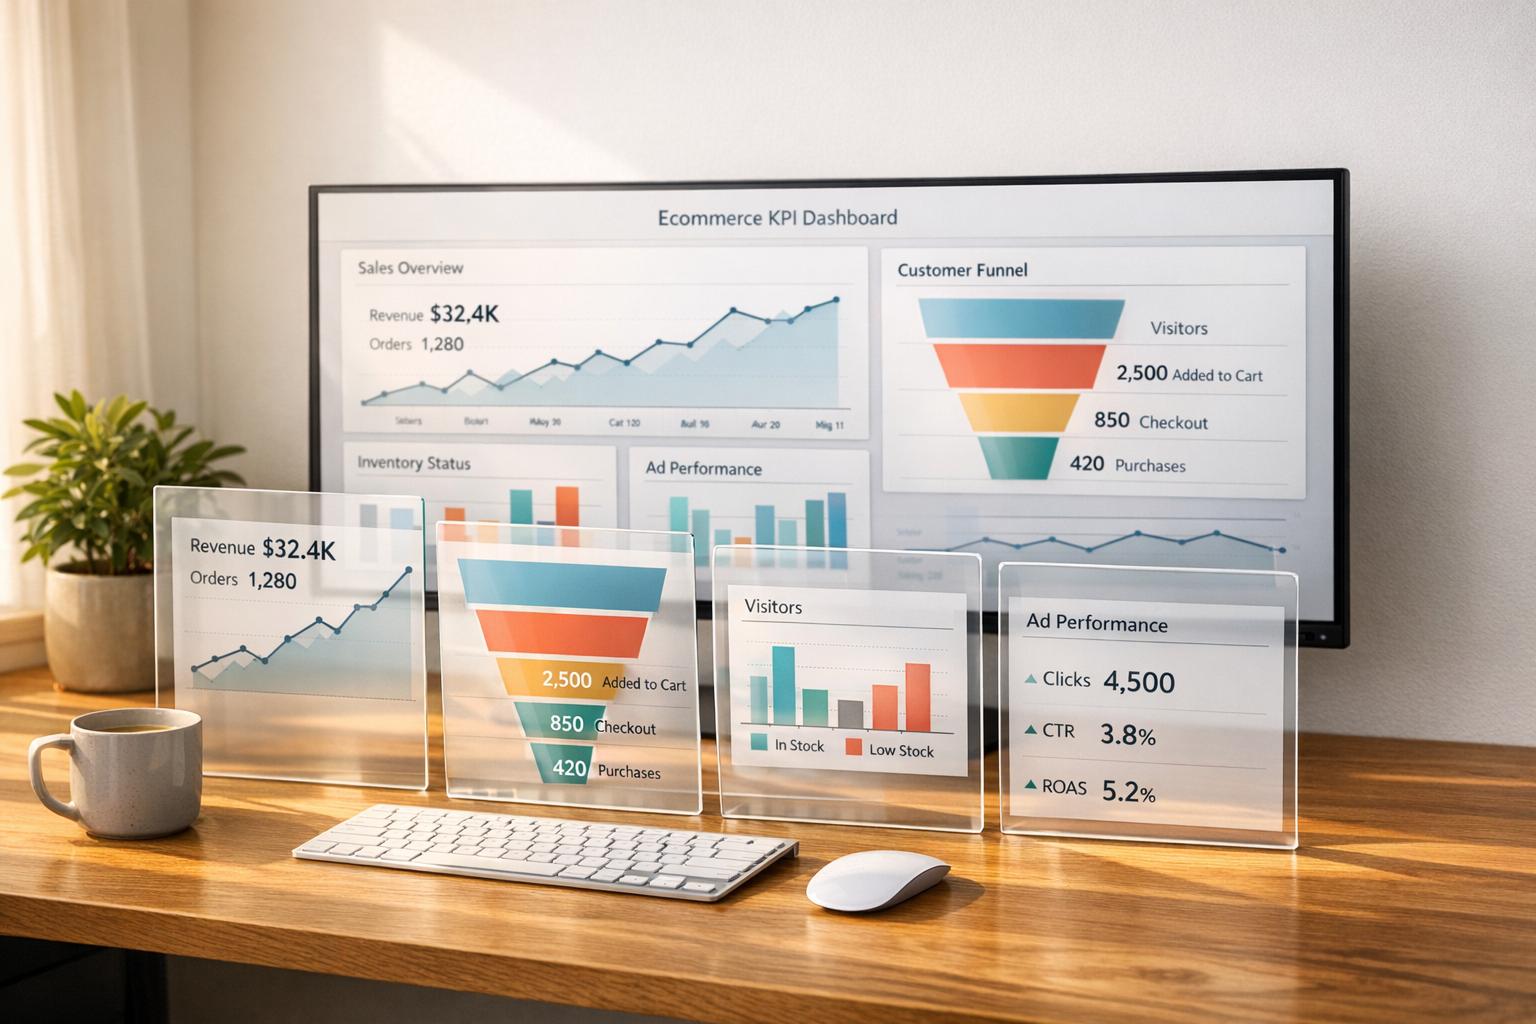
An ecommerce KPI dashboard is a tool that shows your business’s key metrics in one place. It provides real-time data so you can monitor performance, spot trends, and make quick decisions. These dashboards simplify tracking sales, customer behavior, and operations, helping you focus on what drives revenue and customer loyalty.
Here’s what you’ll learn:
- The most important KPIs to track, like conversion rates, average order value (AOV), and customer lifetime value (CLV).
- How to organize metrics by customer journey stages (traffic, checkout, retention).
- Steps to build a dashboard: choose KPIs, connect data sources, and design a clear layout.
- Tips to improve dashboards with tools like PPC data, inventory tracking, and account health monitoring.
Dashboards aren’t just about data – they’re tools for smarter decisions. This guide breaks down how to create one that keeps your team aligned and your business growing.
Ecommerce Sales KPI Dashboard in Power BI | Best Practices
Key Ecommerce KPIs to Track
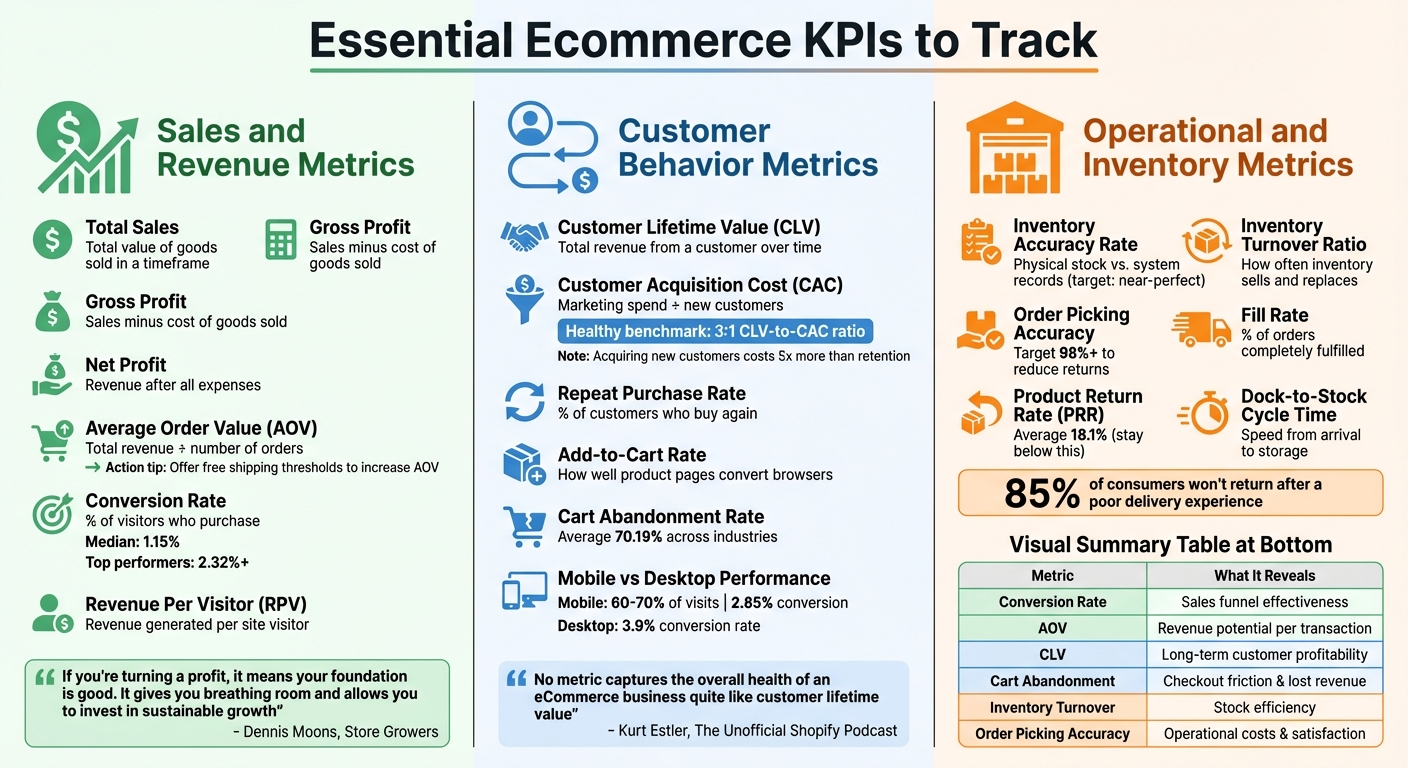
Essential Ecommerce KPIs by Category: Sales, Customer Behavior, and Operations
To grow your ecommerce business, it’s crucial to focus on metrics that directly impact revenue, profitability, and customer retention. Avoid getting distracted by vanity metrics that look impressive but don’t drive actionable results. Below, we’ve grouped the most important KPIs into three main categories to give you a comprehensive view of your ecommerce operations.
Sales and Revenue Metrics
These metrics give insight into how well your business generates and retains revenue:
- Total Sales: The total value of goods sold within a specific timeframe.
- Gross Profit: The difference between total sales and the cost of goods sold, showing how efficiently production and sourcing are managed.
- Net Profit: What’s left after deducting all operating expenses, taxes, and other costs.
Dennis Moons from Store Growers sums it up well:
"If you’re turning a profit, it means your foundation is good. It gives you breathing room and allows you to invest in sustainable growth".
Average Order Value (AOV) measures how much shoppers spend per transaction. You can calculate it by dividing total revenue by the number of orders. Increasing AOV is one of the quickest ways to grow revenue without needing more traffic. For example, offering free shipping on orders over a certain amount (e.g., "Free shipping on orders over $50") often encourages customers to add more items to their carts.
Conversion Rate is another critical metric, reflecting the percentage of visitors who make a purchase. It’s a key indicator of how well your sales funnel performs. While the median ecommerce conversion rate is 1.15%, top-performing sites achieve rates of 2.32% or higher. As Jaykishan Panchal from E2M Solutions explains:
"Your conversion rate is indicative of how successful all of your business strategies are in getting people to engage with your ecommerce website. It influences every key metric".
Revenue Per Visitor (RPV) combines your conversion rate and AOV to show how much revenue each site visitor generates. This metric helps assess whether your marketing efforts attract high-intent buyers or just drive traffic that doesn’t convert.
Customer Behavior Metrics
Understanding customer behavior is just as important as tracking sales.
Customer Lifetime Value (CLV) estimates how much revenue a customer will bring in over their relationship with your brand. Kurt Estler from The Unofficial Shopify Podcast emphasizes:
"No metric captures the overall health of an eCommerce business quite like customer lifetime value".
Pair CLV with Customer Acquisition Cost (CAC), which is calculated by dividing total marketing and sales spend by the number of new customers acquired. A healthy benchmark is a 3:1 CLV-to-CAC ratio, meaning each customer should generate three times the cost of acquiring them. Considering that acquiring new customers costs about five times more than retaining existing ones, tracking Repeat Purchase Rate becomes essential for long-term growth.
Add-to-Cart Rate measures how well your product pages resonate with visitors. A low rate could indicate unqualified traffic or issues with product presentation. Similarly, Cart Abandonment Rate, which averages around 70.19% across industries, points to friction in the checkout process. Eric Melillo from COFORGE advises:
"Monitoring each friction point can help ease the checkout process. Typically, they are easy fixes that create quick wins, produce less abandonment, and generate more completed sales".
Mobile traffic deserves special attention. While mobile devices account for 60% to 70% of ecommerce visits, desktop conversion rates (3.9%) outperform mobile rates (2.85%). Breaking down metrics by device can help identify where user experience (UX) issues are costing you sales.
Operational and Inventory Metrics
Behind every sale is a supply chain that needs to function efficiently:
- Inventory Accuracy Rate: Tracks the difference between physical stock and what your system shows. Achieving near-perfect accuracy prevents stockouts and avoids tying up capital in excess inventory.
- Inventory Turnover Ratio: Measures how often inventory is sold and replaced over a certain period. Use this data to identify slow-moving products and plan future orders effectively.
- Order Picking Accuracy: Ideally, this should be 98% or higher. Low accuracy increases return processing costs and impacts customer satisfaction.
- Fill Rate: The percentage of orders filled completely. Partial shipments can frustrate customers and complicate operations.
Product Return Rate (PRR) is another critical metric. The average ecommerce return rate is 18.1%. Staying below this benchmark signals good product quality and accurate descriptions. High return rates hurt margins and strain your supply chain.
Dock-to-Stock Cycle Time measures how quickly goods move from arrival to storage readiness. Shortening this cycle improves responsiveness and speeds up delivery. As Amazon’s Multi-Channel Fulfillment team highlights:
"The moment an order is placed on any online sales channel, the race to pick, pack, ship, and deliver that order starts – and shoppers expect their products to arrive on time and in perfect condition".
With 85% of consumers unlikely to return to a retailer after a poor delivery experience, operational efficiency directly impacts customer loyalty and repeat purchases.
| Metric Category | Key KPI | What It Reveals |
|---|---|---|
| Sales & Revenue | Conversion Rate | Effectiveness of your sales funnel |
| Sales & Revenue | Average Order Value (AOV) | Revenue potential per transaction |
| Customer Behavior | Customer Lifetime Value | Long-term customer profitability |
| Customer Behavior | Cart Abandonment Rate | Checkout friction and lost revenue |
| Operations | Inventory Turnover Ratio | Stock efficiency and purchasing needs |
| Operations | Order Picking Accuracy | Operational costs and customer satisfaction |
How to Build an Ecommerce KPI Dashboard
Creating an ecommerce KPI dashboard isn’t about cramming every possible metric onto one screen. Instead, it’s about designing a tool that supports smarter, quicker decision-making. To achieve this, you’ll need to focus on three core steps: selecting the right metrics, connecting your data sources, and designing an intuitive layout. Following this approach ensures your dashboard aligns with your business strategy and complements earlier discussions on the importance of KPIs.
Step 1: Select and Prioritize Your KPIs
The first step is to ensure your KPIs directly align with your business goals. For example, if revenue growth is your focus, track metrics like Average Order Value (AOV). If marketing efficiency is a priority, monitor Customer Acquisition Cost (CAC). For customer loyalty, measure Customer Lifetime Value (CLV).
To keep your dashboard clean and easy to use, group metrics by function. Marketing metrics could include traffic and conversion rates, while sales metrics might focus on revenue and transactions. User experience can be evaluated through site speed and bounce rates (a rate above 57% is high), and customer satisfaction can be assessed using tools like Net Promoter Score (NPS) or customer reviews.
Structure your dashboard around the customer funnel to capture the entire journey – from initial traffic to repeat purchases. Highlight "North Star" metrics like revenue quality and unit economics, while using secondary metrics for deeper analysis. Focus only on the metrics that directly impact revenue and customer experience.
| Funnel Stage | Key Performance Indicators (KPIs) |
|---|---|
| Traffic & Engagement | Sessions by channel, New vs. Returning visitors, Engaged sessions per user |
| Product Discovery | Product detail page (PDP) views per session, Search refinement rate, Add-to-cart rate from PDPs |
| Cart & Checkout | Cart abandonment rate, Checkout initiation rate, Checkout completion rate |
| Retention & Value | Repeat purchase rate (30/60/90 days), Revenue share from returning customers, CLV by cohort |
Step 2: Connect Your Data Sources and Tools
Once your KPIs are set, the next step is integrating data from various sources. Choose a visualization platform that fits your needs, whether it’s Shopify Analytics, spreadsheets, or a dedicated business intelligence tool.
Pull data from tools like Google Analytics 4, your ecommerce platform, and ad channels such as Facebook Ads, Google Ads, and TikTok Ads. Native connectors work well for Google-related tools. For other platforms like Meta, TikTok, Shopify, or Amazon, reliable third-party connectors such as Supermetrics, Funnel, Porter Metrics, or Windsor.ai can help.
If you’re managing a large operation, consider centralizing data in a warehouse like BigQuery. This allows you to handle multi-currency transactions, normalize schemas, and safely join data before connecting it to your visualization tool. To maintain consistency, use standardized UTM conventions, align time zones and currencies, and set up automated refresh schedules (hourly or daily) to keep your dashboard updated.
Poor data quality can be costly – organizations lose an average of 12% of revenue due to data issues, and it contributes to 40% of analytics failures. Monitor data quality by checking for missing fields or failed pipeline runs regularly.
Step 3: Design Your Dashboard Layout
A great layout turns raw numbers into actionable insights, making your dashboard a true control panel. Use the right visualizations for each metric: trendlines are ideal for showing growth over time, while scorecards give quick updates on key figures. Keep the main view simple for executives, but include drill-through options for analysts to dive into details, such as where customers drop off during checkout.
Add context to your metrics with comparisons to previous periods, historical benchmarks, and trendlines. As Siva K. Balasubramanian, Associate Dean and Professor of Marketing at Illinois Tech, notes:
"Analytics offers useful techniques to handle this problem by organizing data to develop metrics that are most useful for continuously monitoring business performance".
Segment your data by factors like device (mobile vs. desktop), traffic source, and customer type (new vs. returning). This helps identify friction points. For instance, while mobile devices account for 60% to 70% of ecommerce visits, desktop conversion rates (3.9%) still outperform mobile (2.85%).
Finally, assign team members to oversee specific KPI groups for accountability. Review the dashboard annually to update metrics and visualizations as your business evolves. Use it as a weekly tool to track trends in team meetings, rather than relying solely on monthly reports.
sbb-itb-e2944f4
How Emplicit Improves KPI Dashboard Performance
Creating a dashboard is just the starting point; filling it with actionable insights is what drives business growth. Emplicit takes this concept further by integrating advanced data streams into your dashboard. Their ecommerce services transform basic dashboards into powerful tools for decision-making. By incorporating data like PPC performance, listing optimization, inventory tracking, and account health monitoring, brands gain the ability to make smarter and faster decisions across platforms like Amazon, TikTok Shops, Walmart, Target, and their own ecommerce sites. This approach builds on earlier steps, turning simple dashboards into dynamic tools for growth.
Adding PPC and Listing Optimization Data
Emplicit integrates PPC management data into dashboards, providing real-time insights into advertising performance. Metrics like Cost Per Acquisition (CPA), Return on Ad Spend (ROAS), and Quality Score are pulled automatically from platforms such as Google Ads, Meta Ads, and Amazon Advertising. This setup allows businesses to compare metrics across platforms – like CPA on TikTok Ads versus Google Ads – making it easier to identify which channels deliver better returns.
The dashboard also tracks product-level performance by integrating listing data. This feature highlights which SKUs drive the most revenue and conversions, helping businesses focus marketing efforts on top performers. At the same time, it identifies underperforming products that may need listing optimization. With 73% of customers saying their experience influences their buying decisions, tracking how listing updates impact conversions becomes critical. Attribution modeling ties ad spend to revenue outcomes, giving a full picture of the customer journey from initial interaction to purchase.
Tracking Inventory and Account Health
Emplicit’s inventory management services connect real-time operational data to your dashboard, helping businesses avoid stockouts and unnecessary storage fees. Instead of just showing basic metrics, the dashboard links inventory health to sales velocity and marketplace-specific requirements using the Amazon Selling Partner API (SP-API). This provides actionable insights across multiple marketplaces.
Account health monitoring is another crucial component. The dashboard tracks metrics like Account Health Rating (AHR) and Order Defect Rate (ODR), which directly affect selling privileges. By proactively monitoring these metrics, businesses can avoid suspensions and maintain good standing on marketplaces. Data accuracy is treated as an operational priority, with the dashboard tracking missing fields and failed data pipeline runs to ensure reliability.
Building Dashboards That Scale with Your Business
Once the core metrics are in place, Emplicit ensures your dashboard evolves with your business. As operations expand across channels, their strategies keep dashboards efficient and uncluttered. Using a drill-through architecture, the main view remains streamlined for executives, while analysts can dive deeper into specifics like device performance, channel segments, or cart abandonment patterns. Marketing channels are grouped by user behavior – such as Intent-driven, Relationship-driven, and Discovery-driven – rather than just by source names, maintaining clarity as new platforms are added.
To ensure accountability, Emplicit assigns specific owners to KPI clusters, such as SEO leads or product managers, making it easier to manage complexity as your organization grows. Dashboards undergo annual reviews to refine metrics and align with shifting business goals. This structured approach is vital, especially since data-driven organizations are 23 times more likely to acquire customers and 19 times more likely to be profitable. With marketing budgets shrinking to about 7.7% of company revenue in recent years, having a scalable dashboard that tracks both strategic and operational metrics ensures every dollar is used effectively.
Conclusion and Next Steps
Dashboards work best when they focus on KPIs that impact revenue, unit economics, and customer lifetime value. The most effective ones are structured around the customer journey stages – Traffic, Product Discovery, Cart/Checkout, and Retention – and provide meaningful context using period-over-period comparisons and industry benchmarks. This method reinforces the dashboard design principles and data integration strategies we’ve already covered. As Kurt Elster from The Unofficial Shopify Podcast puts it:
No metric captures the overall health of an eCommerce business quite like customer lifetime value. Conversion rate, average order value, and return customer rate are all reflected in CLTV.
Key Takeaways
Every metric on your dashboard should answer a critical business question. Avoid cluttering it with unnecessary data. Keep an executive-friendly overview while offering drill-through options for deeper dives. Assign ownership of KPIs to ensure accountability and revisit your dashboard annually to adjust metrics as your business evolves. Above all, prioritize data quality.
Focus on profitability-driving metrics and use industry benchmarks – like cart abandonment rates and data accuracy – as a guide. Break down performance by device and traffic source to pinpoint friction points. For example, while mobile accounts for 60% to 70% of visits, its conversion rate is just 2.85%, compared to desktop’s 3.9%.
Get Started with Emplicit
Armed with these insights, consider working with Emplicit to elevate your dashboard’s capabilities. They can help turn your static dashboard into a dynamic growth engine. Emplicit’s comprehensive ecommerce services integrate advanced data streams – such as PPC performance, listing optimization, inventory tracking, and account health monitoring – directly into your dashboard. This works seamlessly across platforms like Amazon, TikTok Shops, Walmart, Target, and your own ecommerce site. The result? You’re not just gathering data – you’re using it to make faster, smarter decisions that grow your business.
Emplicit offers customized strategies tailored to your goals, whether you’re looking to boost conversion rates, fine-tune ad spend, or expand into new markets. Visit Emplicit to see how their data-driven approach can help you create dashboards that provide actionable insights and support long-term growth.
FAQs
How can I select the best KPIs for my ecommerce dashboard?
To select the best KPIs for your ecommerce dashboard, zero in on metrics that directly tie to your business goals and bottom line. Start by pinpointing indicators that address essential questions: Are you attracting the right audience? Are visitors converting effectively? Are your customers contributing long-term value?
Rather than overwhelming yourself with every possible metric, prioritize those that influence revenue, customer engagement, and profitability the most. Key examples include total revenue, conversion rate, average order value, and customer lifetime value. These metrics offer actionable insights, track progress, and support smarter decision-making. The goal is to focus on measurable metrics that drive growth and reveal areas where you can improve.
What are the best tools for connecting data sources to an ecommerce dashboard?
To bring data sources into your ecommerce dashboard, there are several tools designed to make integration and data management straightforward. Supermetrics is a well-known option that connects with a variety of marketing platforms and even allows you to import offline data. Another excellent tool is Keboola, which offers automation and integration features to pull data from sources like Google Sheets, databases, and other systems. For secure syncing of data from ecommerce apps and tools, Panoply is a solid choice, helping you easily analyze and visualize your insights.
Using these tools ensures your ecommerce dashboard provides accurate, up-to-date data, giving you a comprehensive view of your business performance across different channels.
How can a KPI dashboard help boost my ecommerce conversion rate?
A KPI dashboard is a powerful tool for boosting your ecommerce conversion rate by offering clear visibility into critical metrics like traffic quality, funnel performance, and customer behavior. These insights help pinpoint problem areas, streamline your sales funnel, and prioritize strategies that directly impact conversions.
For instance, monitoring metrics such as cart abandonment rates or average session duration can highlight where customers might be dropping off. This allows you to address specific issues with targeted updates. A well-structured dashboard empowers you to make informed, data-driven decisions, ultimately improving the shopping experience and driving better results.