
TikTok Shop has become a major player in e-commerce, generating $9 billion in GMV in its first year in the U.S. with over 398,000 active stores. However, many sellers struggle to understand which ads, videos, or creators drive their sales. TikTok’s traffic attribution system helps solve this by tracking how interactions – like ad views or clicks – lead to purchases. Here’s what you need to know:
- Attribution Models: TikTok uses a 7-day click-through and 1-day view-through attribution window, prioritizing clicks over views.
- Key Metrics: Focus on Gross Merchandise Value (GMV), Click-Through Attribution (CTA), View-Through Attribution (VTA), and engagement metrics like Product Show Rate and Click-to-Order Rate (CTOR).
- Traffic Sources: Sales come from three main sources – paid ads, organic traffic, and affiliate-driven efforts – each tracked differently.
- Tools for Tracking: TikTok Ads Manager, Seller Center, and TikTok Pixel are essential for monitoring performance and aligning data.
- Best Practices: Use consistent attribution settings, UTM parameters, and blended ROI models to better understand TikTok’s impact on sales.
TikTok’s attribution system can reveal indirect paths to purchase, such as when users view an ad but later visit your site directly. Sellers using TikTok’s tools report a 54% increase in conversions and a 27% drop in CPA. Understanding these insights can help optimize campaigns and maximize results.
Stop Losing Money on TikTok Shop: Hive HQ Profit Hack EXPLAINED
sbb-itb-e2944f4
Key Metrics for TikTok Shop Traffic Attribution
Tracking the right metrics is essential for understanding how traffic leads to sales on TikTok Shop. These metrics provide insights into both the sales performance and the customer journey.
Orders and Gross Merchandise Value (GMV)
When it comes to sales, Orders and Gross Merchandise Value (GMV) are your go-to metrics. Orders are tracked by SKU within the specified attribution window, while GMV represents the total amount paid by customers, minus sales taxes and platform discounts.
It’s important to note that sales data is logged differently depending on the platform you’re using. Seller Center records sales based on the transaction day, whereas TikTok Ads Manager operates with a 7-day attribution window. To avoid discrepancies, always confirm the timeframe you’re analyzing.
Click-Through Attribution (CTA) and View-Through Attribution (VTA)
These metrics help you understand how customers interact with your ads before making a purchase.
- Click-Through Attribution (CTA) tracks conversions that occur after a user clicks on your ad, using a 7-day attribution window.
- View-Through Attribution (VTA) captures purchases made by users who saw your ad but didn’t click on it, within a shorter 1-day (24-hour) window.
TikTok uses a Last-Interaction model, prioritizing clicks over views. For instance, if someone clicks on one ad, views another, and then makes a purchase, the credit goes to the most recent click. Additionally, attribution is tied to your Shop ID, not individual products. So, if a user clicks an ad for Product A but ends up buying Product B, the sale is still attributed to your ad performance.
Engagement Metrics
Engagement metrics shed light on how well your ads are capturing interest and moving customers closer to a purchase.
- Enter Room Rate measures how often users enter your LIVE shopping sessions after seeing an ad (livestream page views per ad impression).
- Product Show Rate tracks how effectively your content turns viewers into shoppers. For videos, it’s calculated as Product Details Page (PDP) views per video view; for LIVE content, it’s product clicks per livestream view.
- CTOR (Click-to-Order Rate) evaluates how well your product pages convert interested traffic into buyers. It’s calculated as orders per PDP view. A high click-through rate paired with a low CTOR might indicate that while your ad is engaging, your product page needs improvement.
| Metric | Video Definition | Livestream Definition |
|---|---|---|
| Product Show Rate | PDP views per ad video view | Live product clicks per livestream PV |
| Enter Room Rate | N/A | Livestream PV per ad impression |
| CTOR | Orders per PDP view | Orders per PDP view |
These metrics provide a solid foundation for understanding TikTok’s attribution system, setting the stage for deeper analysis in the next section.
TikTok Shop Attribution Models and Windows
TikTok Shop Attribution Models: Click vs View Tracking Windows
Understanding how TikTok tracks and credits sales is key to analyzing your campaign performance effectively. Building on the earlier discussion of metrics, this section dives into how TikTok’s attribution models and timing windows work.
Attribution Windows
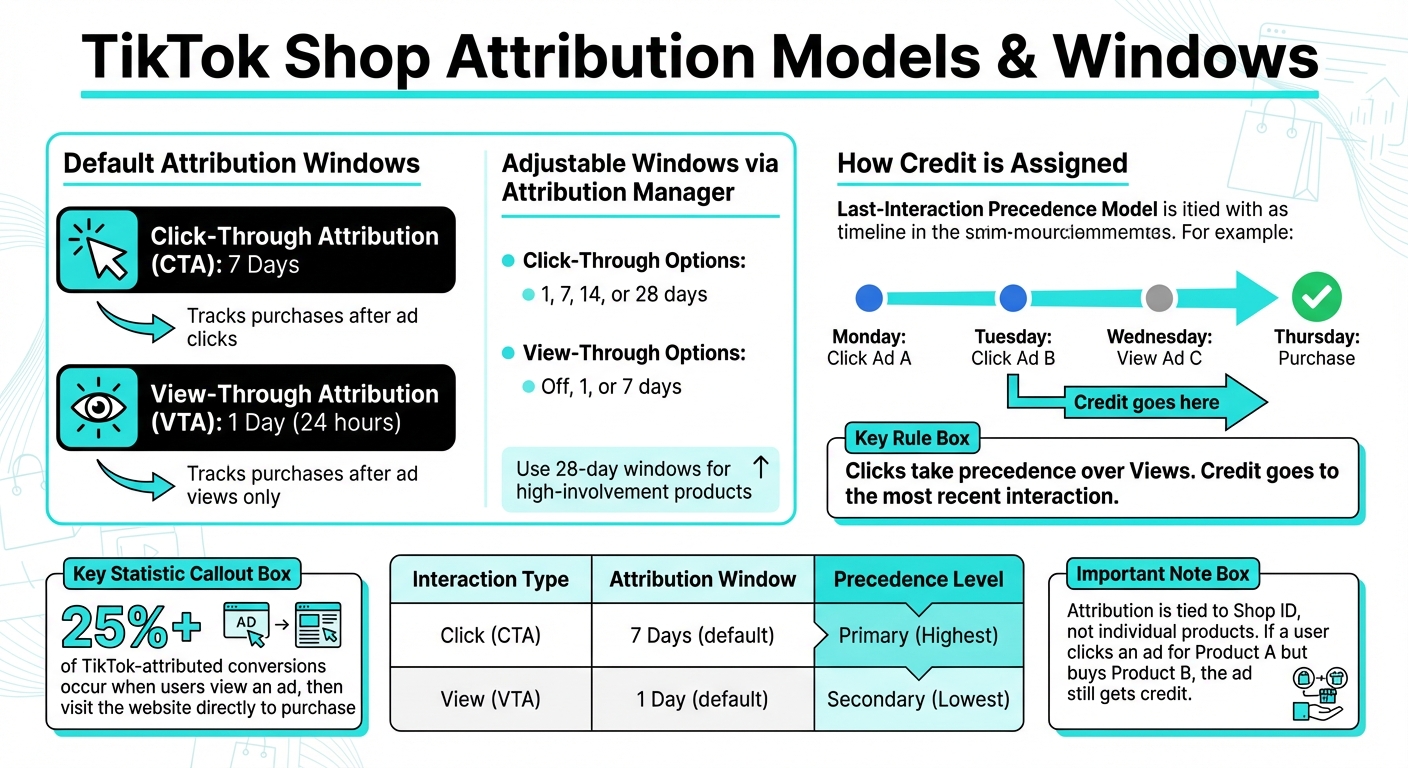
TikTok Shop operates with two default attribution windows: 7-day click-through attribution (CTA) and 1-day view-through attribution (VTA). Here’s how it works: if someone clicks on your ad, TikTok monitors their activity for the next seven days to track any purchases. For users who only view your ad without clicking, the tracking window is limited to 24 hours.
These default settings can be adjusted using TikTok Attribution Manager. You can modify click-through windows to 1, 7, 14, or 28 days and adjust view-through windows to off, 1, or 7 days. For products that require more time for customer research – like high-involvement or expensive items – a longer attribution window of up to 28 days can help capture more conversions.
TikTok also uses a last-interaction precedence model to refine how credit is assigned for conversions.
"We’ll attribute an order to the ad someone interacted with most recently, with Clicks taking precedence over Views." – TikTok Business Help Center
Last-Interaction Precedence
TikTok assigns credit to the most recent ad interaction within the attribution window, prioritizing clicks over views. For instance, if a customer clicks Ad A on Monday, clicks Ad B on Tuesday, and views Ad C on Wednesday before making a purchase, the credit goes to Ad B.
This approach ensures that only one ad is credited per order, and attribution remains tied to your Shop ID, regardless of the specific product purchased. The Performance Comparison tool in TikTok Ads Manager can help you experiment with different attribution windows, providing insights into how these settings impact your reported cost per action and overall conversions. This is particularly valuable since more than 25% of TikTok-attributed conversions occur when users view an ad, then later visit the website directly to complete their purchase.
| Interaction Type | Attribution Window | Precedence Level |
|---|---|---|
| Click (CTA) | 7 Days (default) | Primary (Highest) |
| View (VTA) | 1 Day (default) | Secondary (Lowest) |
Traffic Sources and Attribution in TikTok Shop
TikTok Shop categorizes sales into three main traffic sources: paid, organic, and affiliate-driven. It uses a unique Shop ID and a last-interaction model to track and measure these sources. Each category relies on distinct tools and reporting systems to monitor performance.
Let’s dive into how each traffic source is tracked and measured.
Paid Traffic Sources
TikTok Shop Ads now default to the GMV Max campaign type, designed to optimize ads across TikTok’s feed, search results, and Shopping Center. The goal? To maximize gross merchandise value (GMV). GMV Max includes ad formats like Video Shopping Ads, LIVE Shopping Ads, and Product Shopping Ads. These campaigns are tracked through TikTok Ads Manager, using a 7-day click and 1-day view attribution window for reporting.
Another key tool is Spark Ads, which amplify the reach of high-performing organic posts. These ads retain the native engagement of the original content while driving additional attributed Shop events, effectively boosting both paid and organic performance.
Organic Traffic Sources
Organic traffic refers to sales generated from TikTok features like the Shop Tab, organic livestreams, product cards, and organic search results. These sales are tracked in the Seller Center, appearing under the "Non-Ads Gross Revenue" section in the Data Compass tool. Unlike paid traffic, which ties sales to the date of ad interaction, organic sales are recorded on the actual day of purchase.
A standout feature of organic traffic is the use of product cards in organic videos. These cards allow users to discover and purchase items directly, without any ad spend. Even if a user interacts with one product but later buys a different item from the same shop, the Shop ID attribution model ensures the sale is tracked accurately.
In addition to paid and organic traffic, TikTok Shop capitalizes on affiliate and creator-driven efforts to expand its reach.
Affiliate and Creator-Driven Traffic
TikTok Shop tracks affiliate-driven sales through three distinct scenarios: sales generated solely by affiliates, sales from ads using affiliate-created content, and sales where both overlap. For example, if a creator’s video is used in a Spark Ad or a Video Shopping Ad, the resulting revenue is labeled as "Gross Revenue attributed to both Ads & Affiliate" in the Seller Center. This overlap not only contributes to ad performance metrics but also ensures creators earn their commissions.
The Affiliate Center within Seller Center provides detailed reporting, distinguishing between sales from organic creator posts and those boosted with affiliate content. Importantly, if a creator revokes permission to use their content, any associated ads are automatically paused.
| Traffic Category | Primary Tracking Tool | Key Performance Metrics |
|---|---|---|
| Paid | TikTok Ads Manager | ROAS, Cost Per Purchase, Gross Revenue |
| Organic | Seller Center (Data Compass) | Non-Ads Gross Revenue, Product Show Rate, Enter Room Rate |
| Affiliate | Seller Center (Affiliate Center) | Affiliate Gross Revenue, Orders per Affiliate Video |
Tools for Accessing TikTok Shop Attribution Data
TikTok provides three key tools for tracking attribution data: TikTok Seller Center, TikTok Ads Manager, and TikTok Pixel. Each serves a unique role, working together to ensure precise performance tracking.
Here’s a closer look at how these tools help you access and analyze data:
TikTok Seller Center acts as the control center for managing your shop. Inside, the Data Compass tool breaks down performance by channel – covering videos, livestreams, and product cards – and distinguishes between "Ads Gross Revenue" and "Non-Ads Gross Revenue". Additionally, the Shop Creative Hub offers detailed video-level reporting, providing metrics like GMV (Gross Merchandise Value) and ad conversion rates for individual creative assets.
TikTok Ads Manager is your go-to for tracking paid campaign performance. It attributes conversions based on user interactions with ads, whether through a click (within a 7-day window) or a view (within a 24-hour window). The Attribution Analytics suite dives deeper, offering insights like "Time to Conversion" and "Touchpoints to Conversion". To access key performance indicators such as ROAS (Return on Ad Spend) and Gross Revenue, you can use the "Shop Ads" template within the "Custom Columns" dropdown.
TikTok Pixel, combined with server-side integrations like the Events API, tracks user behavior across platforms by linking external e-commerce sites to TikTok’s ad ecosystem. Businesses that use both tools typically capture 19% more events and improve their cost per action by 15%. TikTok also supports integrations with platforms like Shopify, BigCommerce, WooCommerce, and Salesforce Commerce Cloud, making it easier to streamline data and refine attribution analysis. For troubleshooting, the TikTok Pixel Helper Chrome extension provides real-time pixel verification.
"Seller center reports sales that happen on the day, whereas TikTok Ads Manager reports sales that have happened within the 7-day attribution window." – TikTok Help Center
To ensure accurate tracking, reconcile data between tools by checking Ads Manager’s "Real-time purchases" and "real-time gross revenue", which log same-day conversions. This alignment offers a clearer, more complete picture of your shop’s performance.
Best Practices for TikTok Shop Traffic Attribution
Getting traffic attribution right on TikTok Shop requires a thoughtful approach to setup, monitoring, and data interpretation. Accurate insights depend on maintaining consistent settings, using tracking tools effectively, and embracing a blended measurement strategy. Let’s break down these best practices to help you optimize your campaigns.
Implementing Consistent Settings
Consistency is key for reliable attribution. TikTok Shop Ads come with default settings: a 7-day click-through attribution (CTA) window and a 1-day view-through attribution (VTA) window. Stick with these defaults unless you have a compelling reason to change them. Keep in mind that clicks are always prioritized over views – if a user clicks on one ad and views another within the attribution window, the clicked ad will get credit for the conversion.
To improve tracking accuracy, pair the TikTok Pixel with the Events API. This combination can capture 19% more events and reduce your cost per acquisition (CPA) by 15%. Enable both Manual and Automatic Advanced Matching in TikTok Events Manager to better connect customer actions with TikTok user data. Track the entire customer journey – from viewing content to completing a purchase – instead of focusing solely on the final sale.
Using UTM Parameters and Pixel Tracking
UTM parameters bridge TikTok data with external analytics tools. In TikTok Ads Manager, activate the "Auto attach" feature to automatically add UTM parameters to your ad URLs. This eliminates the risk of manual errors and ensures every campaign is properly tagged.
Since UTM parameters are case-sensitive, stick to a consistent lowercase format (e.g., utm_source=tiktok, utm_medium=cpc) to avoid splitting data into separate rows in tools like Google Analytics. Use TikTok Ads Manager’s URL builder to avoid common syntax mistakes, such as missing "?" or "&" symbols.
For large-scale campaigns, macros can save time by dynamically adding campaign, ad group, and creative details into UTM strings. Always preview your ads and test conversions to confirm that URLs are tagged correctly. Be careful to avoid duplicate parameters – if the same parameter (like utm_source) appears twice, analytics tools may only log the last value.
To fully understand TikTok’s impact, it’s worth exploring blended ROI models.
Blended ROI Models
While individual tracking methods are helpful, they often underestimate TikTok’s role in driving sales. Last-click attribution models, for example, fail to account for users who discover products on TikTok but complete their purchases via search or direct visits.
Blended ROI models offer a broader perspective by combining multiple data sources. These include first-party TikTok Ads Manager data, third-party insights from Google Analytics, feedback from post-purchase surveys, and Media Mix Modeling (MMM). For instance, in early 2024, fashion retailer Underoutfit used Fospha’s daily MMM to evaluate TikTok’s performance. Their initial attribution model showed weak return on ad spend (ROAS), but MMM revealed that TikTok’s actual ROAS was 9x higher, leading to $3.3 million in additional revenue.
"TikTok’s upper-funnel campaigns don’t just build awareness, they drive real revenue. But much of that impact happens beyond what click-based attribution can see. That’s where Marketing Mix Modeling comes in, revealing the true long-term value of upper-funnel activity." – Matthew Barbarasch, SMB NA Marketing Science Lead, TikTok
To capture more insights, use post-purchase surveys to identify initial touchpoints. Integrate Google Analytics 4 with TikTok Ads Manager to align performance metrics and improve conversion tracking. It’s also a good idea to compare different attribution windows (e.g., 7-day click vs. 1-day view) within TikTok Ads Manager to determine what works best for your business.
Common Challenges in TikTok Shop Attribution
Navigating TikTok Shop attribution can be tricky, but understanding the hurdles can help you fine-tune your tracking strategy. Misinterpreting data or overlooking key insights can lead to costly errors.
Delayed Conversions and Multi-Touch Attribution
TikTok often plays a discovery role, with purchases happening later. In fact, over 25% of TikTok-attributed conversions happen after a user views an ad and then directly visits the website to make a purchase the same day. Many businesses, however, use attribution windows that are too short to capture these delayed actions.
The reporting systems add another layer of complexity. TikTok Ads Manager logs sales based on the date of the ad interaction – whether it’s a click or a view. Meanwhile, TikTok Seller Center records sales based on the actual transaction date. For example, if someone clicks an ad on Monday but completes the purchase on Wednesday, Ads Manager credits Monday, while Seller Center credits Wednesday. This mismatch can make it challenging to compare data across platforms.
Traditional last-click attribution models further complicate things. These models fail to recognize TikTok’s role in sparking interest. For instance, a customer might see your product on TikTok, then later search for it on Google or visit your website directly to complete the purchase. Standard analytics tools would credit the conversion to Google or direct traffic, completely overlooking TikTok’s influence.
To tackle these issues, consider reviewing Time to Conversion analytics to adjust your attribution windows accordingly. Additionally, track Assisted Conversions to uncover instances where TikTok played a role in a sale that was finalized through another channel. These timing and platform discrepancies highlight the challenges of multi-touch attribution.
Tool Discrepancies
Beyond timing issues, the differences in how platforms track and report data can distort your conversion insights. For example, TikTok Ads Manager relies on a 7-day click and 1-day view attribution model, while Google Analytics uses a last-click model that ignores view-through conversions. This fundamental contrast means the numbers between these tools will never perfectly align.
TikTok Shop attribution also uses a Shop ID system instead of tracking individual Product IDs. This means if a user clicks an ad for Product A but ends up buying Product B from your shop, the ad for Product A still gets full credit. Unfortunately, third-party tools often miss this nuance, adding to the discrepancies.
On top of that, errors in pixel installation or missing Advanced Matching settings can limit your ability to connect ad interactions with sales. Without properly linking conversion data, some sales may go untracked.
"Even when TikTok isn’t the last click channel, it sparks discovery that drives conversions on other channels like search, websites, in-store, and marketplaces. But without advanced measurement, TikTok’s true ROI is consistently undervalued." – TikTok for Business
To reconcile these differences, use TikTok Attribution Analytics with the "Real time" filter, link Google Analytics 4 (which has been shown to increase conversions by 54% and reduce cost per action by 27%), enable Advanced Matching on your TikTok Pixel, and standardize UTM parameters across campaigns. These steps can help you bridge the gap between platforms and better understand TikTok’s role in your sales funnel.
Optimizing TikTok Shop Attribution with Emplicit
Tracking sales on TikTok Shop can be tricky, with data inconsistencies and attribution gaps creating challenges for brands. Emplicit steps in to tackle these issues with precision. With a decade of experience managing $550 million in sales and $100 million in ad spend – including TikTok Shop – Emplicit bridges tracking gaps and ensures smooth inventory management.
PPC and Marketplace Management
Emplicit’s pay-per-click (PPC) strategies are designed to make the most of TikTok’s attribution windows – 7-day click and 1-day view – to boost return on ad spend (ROAS). They utilize over 50 proven marketing techniques to target the right audience at the right time. TikTok’s attribution system, which ties sales to Shop IDs rather than individual product IDs, is a challenge many brands face. Emplicit uses this knowledge to optimize campaigns across entire catalogs.
Take AllGood, a consumer health solutions brand, as an example. With Emplicit’s expertise, AllGood saw a staggering 500% growth in just three months. Their monthly revenue jumped from $35,000 to $165,000, all while maintaining flat agency fees. This is just one example of how Emplicit’s ad management strategies can deliver measurable results.
Custom Strategies for Scaling Traffic
Emplicit employs its proprietary 4D Plan – Diagnose, Design, Deploy, Dominate – to tackle attribution issues and craft tailored strategies that drive growth. During the Diagnose phase, they pinpoint tracking gaps, while the Design phase develops data-driven solutions. These strategies have delivered impressive results, such as Trtl Travel, a $3 million travel products brand, which experienced 400% growth within a year.
Emplicit’s full-service approach doesn’t stop at ad campaigns. They integrate marketing, content, inventory, and logistics to ensure every aspect of attribution is optimized.
"You’ll have access to a full team of subject matter experts, including product, compliance, inventory, logistics, marketing and content; Working together to maximize your sales and margins." – Emplicit
Inventory and Account Health Management
Maintaining inventory and account health is critical for keeping your attribution data accurate. Stockouts or account suspensions can disrupt sales data during high-traffic periods, leading to missed opportunities. Emplicit’s proactive inventory management helps brands avoid these pitfalls. By maintaining an SPS (Star Performance Score) above 4.0, they ensure clients earn TikTok’s coveted "Star Shop" badge, which boosts creator collaborations by 35%.
For example, probiotic brand Just Thrive achieved consistent 20% year-over-year growth for four years, resulting in a total growth of 210%. By preventing account suspensions and ensuring operational continuity, Emplicit keeps attribution data flowing smoothly and sales performance on track.
Conclusion
Getting a handle on TikTok Shop traffic attribution means focusing on three key areas: metrics, tools, and best practices. Keep an eye on orders, GMV, and both click-through and view-through attribution. TikTok assigns conversions to a Shop ID, and timing is everything – especially with the platform’s 7-day click and 1-day view attribution windows. When both clicks and views happen, clicks take priority. These factors are the backbone of TikTok’s attribution framework.
There’s also a difference in how sales data is reported: Seller Center logs sales on the day they happen, while Ads Manager connects them to the moment of ad interaction. To fill in the gaps, tools like Google Analytics 4 can provide a more complete picture.
Understanding the full customer journey is just as important. For example, over 25% of TikTok-attributed conversions happen when someone views an ad and then visits your website directly on the same day – a behavior traditional tracking methods often miss. Features like Assisted Conversions and Post Purchase Surveys can highlight TikTok’s role in conversions, even when it’s not the final touch point.
"Without advanced measurement, TikTok’s true ROI is consistently undervalued, leaving advertisers unable to report or fully understand the real impact of their investment." – TikTok Business Blog
Emplicit offers an integrated approach to tackle attribution challenges head-on. By combining PPC optimization, inventory management, and account health monitoring, they ensure accurate attribution data while driving real, measurable growth. With expert guidance, these challenges can become opportunities for success.
FAQs
Why does TikTok’s attribution model prioritize clicks over views?
TikTok’s attribution model leans heavily on clicks rather than views, using a 7-day click window compared to just a 1-day view window. Essentially, if a user both clicks and views, the most recent click gets credited for the order. This setup prioritizes tracking actions that show stronger intent, as clicks usually signal deeper engagement than a simple view.
By emphasizing clicks, TikTok offers businesses clearer insights into customer behavior, making it easier to adjust strategies and improve conversion rates.
What are the best tools for tracking TikTok Shop performance?
To effectively track your TikTok Shop’s performance, start by integrating the TikTok Pixel into your e-commerce site and tagging your URLs with UTM parameters. This setup allows you to monitor clicks, conversions, and shopper behavior with precision. Pair this with TikTok Analytics and the Seller Center Shop Ads dashboard to keep an eye on key metrics like impressions, clicks, click-through rates (CTR), cost-per-click (CPC), purchases, and return on ad spend (ROAS) in real time.
For a deeper understanding of your campaigns, use TikTok Ads Manager’s Attribution Analytics. This tool offers detailed reports on performance comparisons, time-to-conversion, and multi-touch attribution. To further validate your ad performance and collect valuable customer feedback, consider implementing Split Testing and Post-Purchase Surveys. By combining these tools and strategies, you can make informed, data-driven decisions to fine-tune both your organic and paid sales efforts.
How can sellers use TikTok Shop attribution data to improve their ad campaigns?
Sellers can tap into TikTok Shop’s attribution data to refine their ad strategies by diving into critical metrics like 7-day click and 1-day view attribution windows, purchases, return on ad spend (ROAS), and cost-per-purchase. You can find these valuable insights in the Seller Center’s Shop Ads reports.
TikTok’s Attribution Analytics goes a step further by offering tools such as performance comparison, time-to-conversion analysis, and touchpoint tracking. These features help pinpoint which ad interactions are driving the most conversions. By using view-through attribution and split-testing, sellers can fine-tune their targeting, bidding tactics, and creative content to achieve better results.