

Most TikTok trends are over in 48–96 hours, so if your team moves late, you miss the sale. I’d boil this guide down to one idea: use a simple system to spot trends early, score them for product fit, post within 24–48 hours, and judge them by revenue, add-to-cart rate, and revenue per view instead of views alone.
Here’s the short version:
- I look for trends in TikTok Creative Center, the FYP, niche hashtags, search, competitor posts, and sales data.
- I score each trend on a 10-point scale based on velocity, repeatability, niche fit, audience intent, and music rights.
- I keep a 70/30 mix: about 70% planned content and 30% trend slots.
- I post trend content fast, often in the first 48 hours.
- I test 3–5 versions and review results after 48–72 hours.
- I care more about sales signals than vanity numbers.
A few numbers stand out:
- Trend formats often peak in 2–4 days
- Short videos should aim for about 70%+ completion in strong cases
- Weak hooks often show up when the 3-second hook rate drops below 20%
- For short clips, completion under 40% is a warning sign
- Profile click-through often lands around 1%–3%
- A good share/save rate can be 5%+
If I were setting this up for an ecommerce brand, I’d keep it simple: find trends early, only use the ones that fit the product, batch fast, and make sure the store side is ready too – inventory, product pages, and TikTok Shop checkout all need to work.
| Focus Area | What matters most |
|---|---|
| Trend timing | Post before the peak, not after it |
| Trend selection | Pick trends that fit the product naturally |
| Calendar mix | Use a 70/30 planned-to-trend split |
| Testing | Shoot multiple versions and change one thing at a time |
| Reporting | Track revenue, add-to-cart rate, and revenue per view |
That’s the core of the article: stop chasing random trends and build a repeatable process that ties TikTok content to sales.
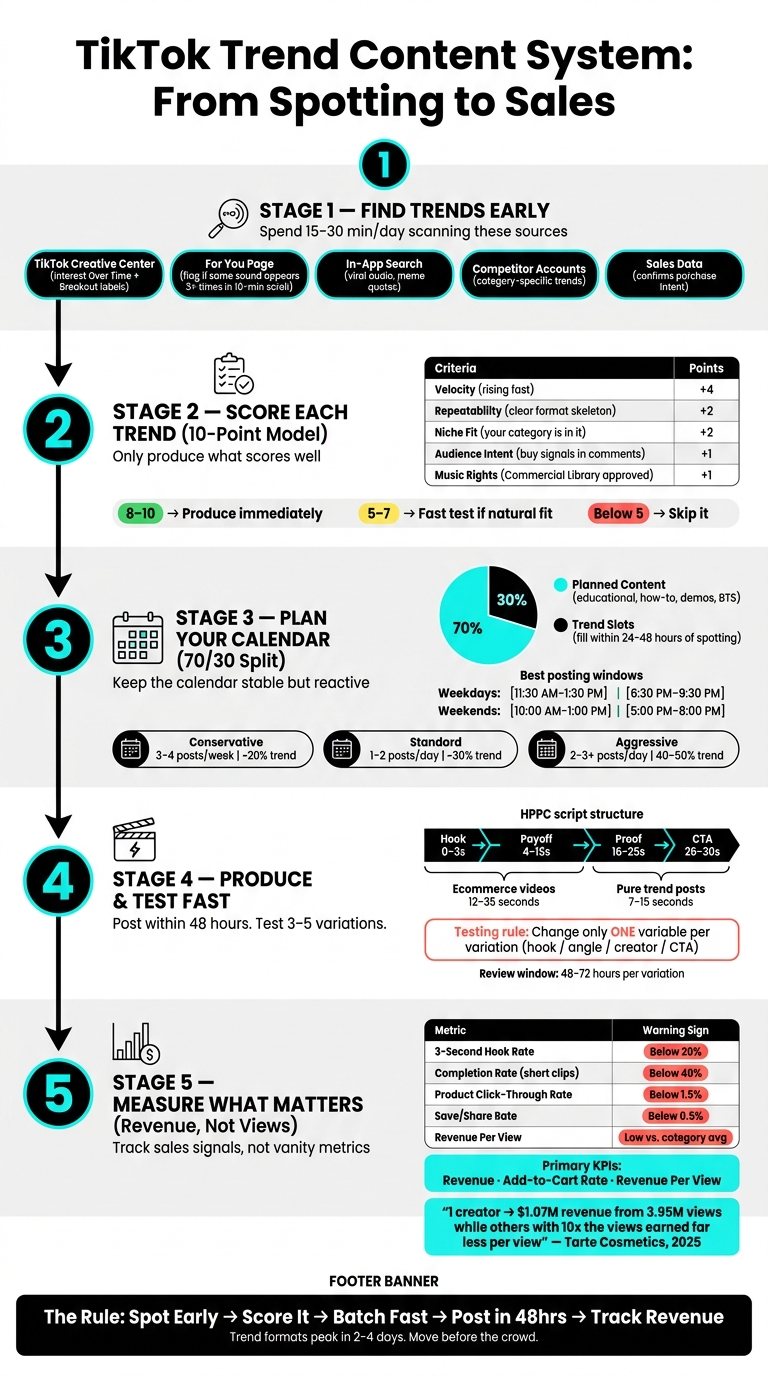
TikTok Trend Content System: From Spotting to Sales
How To Find and Score TikTok Trends Before They Peak
If you want to catch trends early, you need a simple daily routine. A lean team can spend 15–30 minutes a day scanning TikTok Creative Center, the For You Page (FYP), and niche hashtags like #skintok or #foodtok.
Where to monitor trends every day
Start with TikTok Creative Center. It shows Interest Over Time graphs, breakout status, and top songs and hashtags. When you see labels like Breakout or New to Top 100, treat them as a prompt to test fast.
Then check your FYP. This is where TikTok starts surfacing formats, sounds, and clips that are picking up steam in real time. A simple rule helps here: if you spot the same sound or format 3+ times in a 10-minute scroll, flag it.
You should also search niche phrases like "viral sound", "transition sound," or "gym meme sound." That helps you find user-generated audio and meme dialogue that Creative Center may not pick up.
One more filter matters: sales data. A trend can pull views and still do nothing for revenue. Sales data helps confirm whether a trend is driving orders, not just attention.
Once a trend shows repeat momentum, score it before your team puts time into production.
A simple trend scoring model for product fit and urgency
Before approving production, run each trend through a fast 10-point score.
| Criteria | Points | What to Look For |
|---|---|---|
| Velocity | +4 | Interest Over Time is rising fast |
| Repeatability | +2 | Format has a clear timing skeleton you can adapt without relying on a specific creator |
| Niche Fit | +2 | Your product category is already participating in the trend |
| Audience Intent | +1 | Comments show users asking "where to buy?" or tagging friends |
| Music rights | +1 | Audio is in the Commercial Music Library or approved for business use |
Here’s how to read the score:
- 8–10: produce right away
- 5–7: worth a fast test if the idea fits in a natural way
- Below 5: skip it
The biggest signal is velocity, not total video count. That’s the difference between riding a wave early and showing up after the crowd.
Comparison table: trend sources and what each one helps you detect
| Source / Tool | Best Use Case | Strengths | Limitations |
|---|---|---|---|
| TikTok Creative Center | Validating momentum with real analytics | Shows Interest Over Time and breakout status | Misses user-generated audio and meme clips |
| In-App FYP | Spotting early formats before they’re indexed | Best for detecting sounds repeated 3+ times in a 10-minute scroll | Subjective; time-consuming to standardize |
| In-App Search | Finding non-professional audio and meme quotes | Catches meme quotes and viral dialogue clips | Not reliable for tracking broad trend momentum |
| Competitor Accounts | Seeing how your category is already adapting trends | Identifies trends already converting in your specific category | Reactive; by the time you see it, you may be late |
| Sales Data | Confirming a trend actually drives purchases | Separates viral noise from real sales potential | Lags behind real-time trend signals |
If you’re using a business account, stick to audio from the Commercial Music Library or sounds approved for business use. That helps you avoid muting or takedowns.
Use the fastest signal source as your trigger, then move the winners into your weekly content calendar.
sbb-itb-e2944f4
How To Build a TikTok Trend Content Calendar Your Team Can Repeat
When a trend gets a strong score, don’t let it sit in a spreadsheet. Put it into your weekly calendar right away.
Each scored trend needs three things:
- a clear slot
- a product owner
- a posting deadline
That simple step turns trend spotting into a repeatable workflow instead of a scramble.
Set a weekly planning cycle with trend slots and product priorities
Use the same weekly rhythm every week: review analytics, batch film, edit, schedule, and keep one buffer day open for backup content. Then rank your calendar slots by trend score and assign the best-fit products first.
For seasonal campaigns, plan posts 2–3 weeks ahead of major U.S. retail moments like Valentine’s Day, Mother’s Day, Back to School, and Black Friday/Cyber Monday.
Timing matters too. A trend’s first 48 hours often matter most, so your posting windows should line up with that early reach.
Use these time blocks:
- Weekdays: 11:30 AM–1:30 PM and 6:30 PM–9:30 PM local time
- Weekends: 10:00 AM–1:00 PM and 5:00 PM–8:00 PM local time
Think of it like shelf placement in a store. Even a strong product can miss if it shows up in the wrong spot at the wrong time.
Choose a posting cadence based on team size and SKU volume
There’s no single right posting frequency. The best cadence is the one your team can keep up without letting quality slip.
For most ecommerce brands, a 70/30 split is a solid working model. Plan 70% of your calendar ahead of time around repeatable content pillars like educational or how-to videos, behind-the-scenes clips, and product demos. Leave the other 30% open for reactive trend participation.
Those open slots should be filled within 24–48 hours of spotting a trend.
This is what keeps your calendar stable without making it rigid. You know what you’re posting, but you still have room to jump on what people care about now.
Comparison table: conservative, standard, and aggressive calendar models
| Model | Posts Per Day/Week | Share of Trend Content | Resource Requirements | Benefits & Risks |
|---|---|---|---|---|
| Conservative | 3–4 posts per week | ~20% | 1 part-time creator; basic phone setup | Benefit: Low burnout. Risk: Slower growth |
| Standard | 1–2 posts per day | ~30% | 1–2 people; batching workflow; scheduling tools | Benefit: Ideal for growth; consistent data signals. Risk: Requires disciplined batching |
| Aggressive | 2–3+ posts per day | 40%–50% | 3–5+ people (strategist, creator, editor); UGC partners | Benefit: Rapid scaling; maximum reach. Risk: High production cost; potential creator burnout |
Once the calendar is locked in, each slot should move straight into scripting so the first cut can be tested fast.
How To Turn Trends Into Scripts, Videos, Tests, and Reports
Once a trend earns a spot, push it right into scripting, filming, testing, and reporting. The goal is simple: take an approved idea and get it into a live test fast.
Use script templates that fit common TikTok trend formats
A simple way to shape the script is the four-part hook-payoff-proof-CTA structure, or HPPC: hook (0–3s), payoff (4–15s), proof (16–25s), and CTA (26–30s). It gives the video a clear path instead of letting it drift.
A problem-solution script can open with something like "Stop scrolling if you [pain point]: I tried [product] so you don’t have to." A result-first hook puts the final transformation in the first 2 seconds, then walks through how it happened. You can also use a pattern break, like walking into frame backward, to stop the scroll and hold attention.
For length, keep ecommerce videos between 12–35 seconds. For pure trend posts, aim for 7–15 seconds to get more people to watch to the end. Shoot vertical, use natural light, and film with your phone’s back camera.
Plan variations and test them over 48–72 hours
Film 3–5 variations in one session, but change only one variable at a time. That could be the hook, the angle, the creator, or the CTA. If you change too much at once, you won’t know what moved the result.
Use soft CTAs on organic posts, like "Save this for later". Use hard CTAs on conversion-focused content, like "Comment ‘LINK’ for the discount".
Let each variation run for 48–72 hours. Then check the numbers:
- If a 10–15 second clip has a completion rate under 40%, archive it or rework the hook.
- If the hook rate drops below 20%, swap the opening frame before the trend window closes.
Comparison table: key TikTok trend content metrics and how to act on them
Use these metrics to decide whether to refine, repost, or retire a variation.
| Metric | What it shows | Warning Sign | Likely issue | Next Optimization Action |
|---|---|---|---|---|
| 3-second hook rate | Initial scroll-stop power | Under 20% | Weak visual or flat opening line | Refilm the first 2 seconds; add bold on-screen text |
| Completion rate | Pacing and content relevance | Under 40% (short clips) | Video is too slow or padded | Cut filler; move the product reveal earlier |
| Product click-through rate | Shopping intent | Under 1.5% | CTA is weak or product value isn’t clear | Test a direct CTA; show the product sooner |
| Save/share rate | Utility and relatability | Under 0.5% | Content feels too promotional | Reframe as a how-to or a relatable POV |
| Revenue per view | Overall conversion efficiency | Low vs. category average | Wrong audience or missing social proof | Add UGC or testimonials; test a different creator style |
Views can look nice in a dashboard, but they don’t tell the whole story. Revenue per view says more about whether the angle led to orders.
The gap can be huge. In a March–August 2025 Tarte Cosmetics campaign, one creator generated over $1.07M from 3.95M views, while others with nearly 10x the views generated far less revenue per view. That’s why reports should focus on revenue per view, not impressions.
Conclusion: Build a Repeatable Trend System and Back It With Clean Ecommerce Operations
Once your calendar is live, execution is what turns trend content into revenue. This system only works when trend spotting, product fit, production speed, and revenue tracking stay tied together. If one link breaks, results slip.
Speed matters. But conversion depends on what happens after the click. A viral video can still flop if inventory is off, product listings are weak, or checkout feels clunky. Before you post, make sure stock is in place, product pages are ready, and TikTok Shop checkout works the way it should.
5 rules to keep the system working
- Act fast: publish within 24–48 hours of spotting a trend.
- Only chase trends that fit your product. Going after trends without product fit leads to low conversion and off-brand content.
- Batch variations to move while the trend is still hot.
- Track revenue outcomes, not views.
- Use results to shape next week’s calendar. The system gets better when you close the loop.
Where Emplicit fits for brands that need execution support
Some brands need help keeping all of this moving. In that case, operational support can keep execution steady. Emplicit helps U.S. ecommerce brands manage TikTok Shop strategy, content planning, inventory, listings, and account health, so trend content can go from trend detection to conversion with less friction.
FAQs
How do I know if a trend fits my product?
Use a standard intake checklist to review each trend for audience fit, brand safety, product relevance, timing, and format fit.
Put the most weight on trends where your product shows up naturally and backs up your core message. If approvals will drag on too long, pass on it unless the trend is likely to stick around. If you’re on the fence, test two fast versions and use early performance data to decide whether to scale, refine, or drop it.
What should I do if a trend gets views but no sales?
Treat it as a sign that something in the customer journey is falling apart.
Start by checking your conversion rate and attribution. That helps you see whether sales are actually missing or just not being counted the right way.
If CTR is strong but conversions stay low, the problem is usually the landing page or the price point. If watch-through is high but CTR is weak, your CTA or offer likely needs work.
You can use A/B testing to compare different hooks, product placement, or format. Then make the call: adjust, pivot, or stop the trend.
How can a small team keep up with TikTok trends?
Use a repeatable, data-first workflow with a 70/30 content split: 70% evergreen content and 30% set aside for trend-based posts.
Keep the whole system simple enough to stick with. A daily 15–20 minute trend check is usually enough to spot what’s worth acting on without letting it eat up the day.
To keep things moving, lean on:
- a light approval process
- ready-made templates
- twice-weekly batch filming
- clear roles for each person involved
- AI support for scripts, hooks, and captions
The goal isn’t perfect content every time. It’s showing up on a steady basis and making the process easy enough to repeat.