
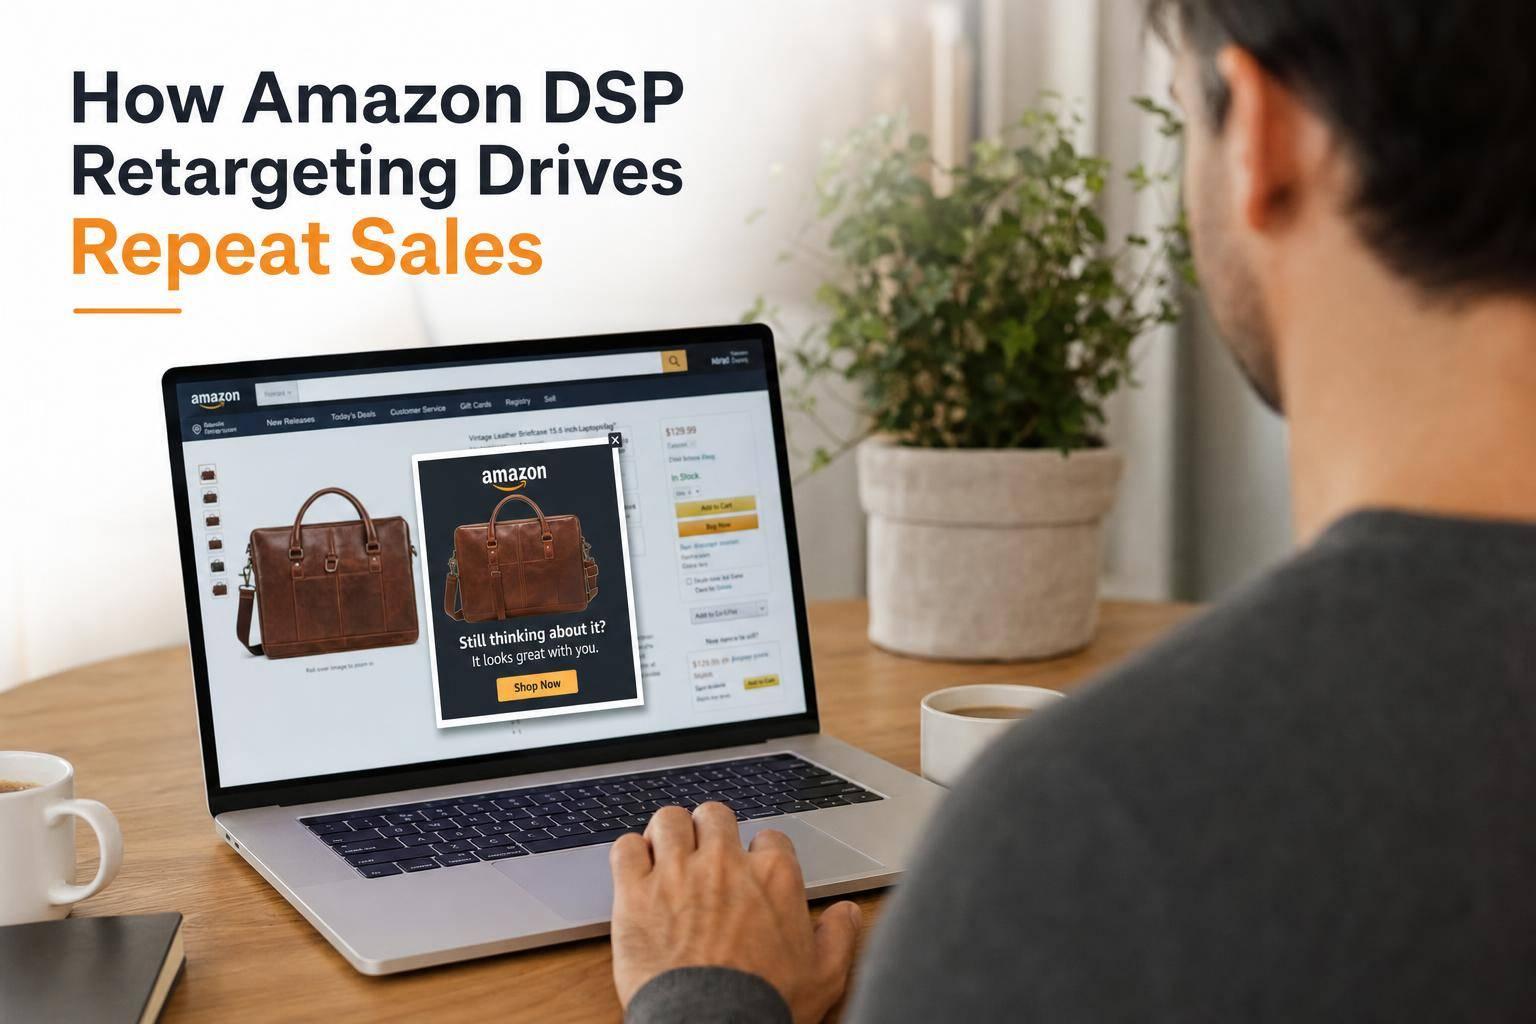
Amazon DSP retargeting can drive more repeat orders when I target the right shoppers, time ads to the reorder cycle, and keep frequency under control. In this article, I focus on four audience groups – cart abandoners, product viewers, past purchasers, and category browsers – then split them into replenishment, cross-sell, and win-back campaigns.
Here’s the short version:
- Cart abandoners often deliver the strongest return, with reported ROAS in the 8x–15x range.
- Product viewers often land around 4x–8x ROAS.
- Past purchasers can top 10x ROAS when ads run near the reorder window.
- Category browsers usually sit lower, around 2x–4x ROAS, and work better as a feeder audience.
I also cover the settings that shape results:
- Look-back windows by audience type, such as 3–7 days for cart abandoners and 30–90 days for many past-purchaser campaigns
- Frequency caps like 3–5 impressions per day for cart abandoners and 1–2 per day for past purchasers
- Measurement beyond ROAS, including repurchase rate, time between orders, cost per incremental order, and 6–12 month customer value
One number stands out: in one set of 80 DSP retargeting audits, platform-attributed ROAS averaged 6.2x, while incremental ROAS was only 1.4x. That’s why I don’t stop at reported conversions.
If you want repeat sales from Amazon DSP, the play is simple: start with high-intent audiences, match timing to buying cycles, cap impressions, and measure repeat-order lift – not just top-line ROAS.
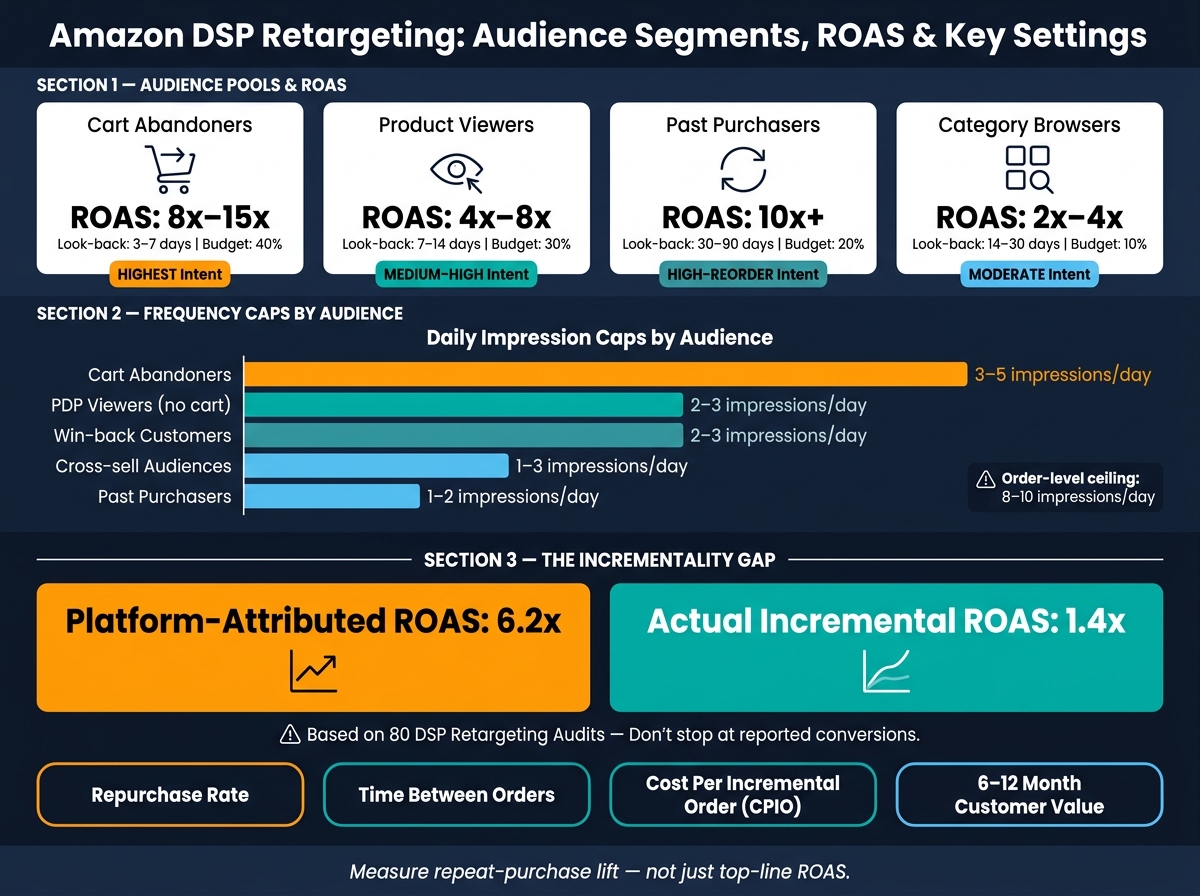
Amazon DSP Retargeting: Audience Segments, ROAS & Settings at a Glance
Build the Right Audience Pools in Amazon DSP
Start with Highest-Intent Audiences
Start by ranking audiences based on how close they are to buying: cart abandoners, recent product viewers, past purchasers, and then category browsers. Each group lines up with a different point in the repeat-sales funnel. And they get even more useful when you break them out by behavior and purchase stage.
Cart abandoners put your product in the cart, then left without checking out. This group usually brings in the highest ROAS, often 8–15x. Put your strongest bids here and give this pool the biggest share of your retargeting budget.
Recent product detail page (PDP) viewers are usually your biggest high-intent audience. ROAS often falls in the 4–8x range. A 7–14 day look-back window usually works well. Keep spending here strong, but still below cart abandoners.
Past purchasers are your retention audience. If you sell replenishable products, this group can drive more than 10x ROAS when ads show up around the reorder window.
Category browsers looked at a category, not your brand. Their ROAS usually lands around 2–4x, so they work best as a way to feed higher-intent pools over time, not as a place to pull budget away from stronger audiences. Think of them as a feeder pool for future repeat sales.
Match Look-Back Windows to Buying Cycles
The look-back window controls how far back Amazon DSP can reach. If the window is too wide, you waste spend. If it’s too tight, delivery gets limited.
For cart abandoners, begin with a 3–7 day window. For product viewers, 7–14 days tends to catch shoppers who are still actively in-market.
Past purchasers need windows that match your product’s reorder cycle. Fast-moving consumables like supplements fit a 30–60 day window. Bigger household consumables may need 60–90 days. Durable goods usually call for longer windows for cross-sell and upgrade offers, often 90–180 days.
Category browsers usually fit best in a 14–30 day range. That keeps you in front of people who are still researching without drifting into cold traffic.
Audience Pool Comparison Table
| Audience Pool | Intent Level | Look-Back Window | Funnel Role | Use Case |
|---|---|---|---|---|
| Cart Abandoners | Highest | 3–7 days | Conversion | Recover near-purchases |
| Product Viewers | Medium-High | 7–14 days | Consideration | Convert in-market shoppers |
| Past Purchasers | High (reorder) | 30–90 days | Retention/Loyalty | Drive replenishment and cross-sell |
| Category Browsers | Moderate | 14–30 days | Awareness/Discovery | Introduce hero products |
A good starting budget split looks like this: 40% to cart abandoners, 30% to product viewers, 20% to past purchasers, and 10% to category browsers. Then adjust based on repeat-order rate and cost per reordered unit. The next step is to turn these pools into separate campaigns for repeat purchase, cross-sell, and win-back.
sbb-itb-e2944f4
5 Amazon DSP advertising strategies that actually work (No One Talks About #3)
Segment Shoppers by Behavior and Purchase Stage
Once your audience pools are built, split them by intent and recency so your bids and ad creative line up with what shoppers have actually done. If you keep segments too broad, you end up spending money on people who are just browsing and people who are ready to buy as if they were the same. That’s where waste creeps in.
For repeat sales, this step matters even more. Start by sorting shoppers based on how deeply they engaged. Then split past buyers based on the next action you want from them.
Separate Audiences by Engagement Depth
Not every product page view means the same thing. A quick glance is one thing. Multiple visits, cart activity, or video views tell a very different story.
Here’s a simple way to break it out:
- Single-page viewers: low intent, 14–30 day window, low bids.
- Multi-session browsers: repeated comparison shoppers, 7–21 day window, moderate bids, messaging that leans on reviews, bundles, or subscribe-and-save options.
- Add-to-cart users: highest near-term intent, 3–10 day window, highest bids.
- Deep engagers: video, enhanced content, or 5+ PDP visits; 7–14 day window; objection-handling creative.
Once you’ve mapped engagement depth, split past buyers into separate groups for repeat purchase, cross-sell, and win-back.
Split Repeat-Purchase, Cross-Sell, and Win-Back Groups
Past purchasers shouldn’t sit in one catch-all audience. Break them out by the sale you want next: a reorder, an add-on purchase, or a return after a lapse. Put differently, separate them into replenishment, cross-sell, and win-back groups. For replenishment, target the reorder window. For cross-sell, use the period when a related product starts to make sense. For win-back, go after buyers who’ve been inactive for a set amount of time.
Timing should follow supply length. A common setup is 25–45 days after a 30-day supply and 55–75 days after a 60-day supply. The message should stay tight: reorder reminders, “never run out” framing, and subscription nudges.
Cross-sell buyers bought one product and are good candidates for a related one. A 30–90 day window often works well, depending on how soon the second product becomes relevant.
Win-back customers haven’t reordered within a set period – often 90 days for frequently used items or 180 days for seasonal products. Win-back creative should lead with what changed: a new formula, better packaging, or stronger reviews.
Behavior-to-Strategy Table
| Segment | Behavioral Criteria | Messaging Focus | Bid Priority | Role in Repeat Sales |
|---|---|---|---|---|
| Single-page viewers | Viewed PDP once; no cart or purchase | Product reminder, core benefits | Low | Builds higher-intent pools |
| Multi-session browsers | 3+ views or 2+ sessions; no purchase | Comparison, reviews, subscription intro | Medium | Stronger intent; good for first-purchase conversion |
| Add-to-cart users | Added to cart; did not check out | Urgency, cart completion, reassurance | High | Highest near-term conversion potential |
| Deep engagers | Viewed video, enhanced content, or 5+ PDP visits | Objection handling, long-term value, multi-pack | High | Strong buying intent; prime for subscription offers |
| Replenishment buyers | Purchased; nearing reorder window | Restock reminder, subscribe-and-save | High | Core driver of repeat purchase and LTV |
| Cross-sell buyers | Purchased product A; no purchase of product B | Bundle, complementary use case | Medium | Increases basket size and repeat revenue |
| Win-back customers | No reorder within 90–180 days | Re-engagement, product updates, incentive | Medium | Recovers lapsed customers; renews purchase cycle |
A clean naming system makes this much easier to manage. Labels like RET_Cart_7d_HighIntent or CUST_Replenish_30d pack behavior, recency, and campaign goal into one line, so teams can spot the right segment fast and change settings without guessing.
These segments only work if delivery is paced the right way.
Set Frequency Caps and Delivery Rules
Once your segments are set, frequency caps control how often each shopper sees your ads. That matters for three simple reasons: spend control, lower ad fatigue, and better efficiency. Without caps, a small slice of users can eat up too many impressions. Then your budget starts leaking into overexposure instead of better reach. A smart move is to cap delivery by audience, so high-intent shoppers get more visibility while lapsed buyers get less.
Choose Starting Frequency Caps by Audience Type
Your starting cap should match shopper intent. Cart abandoners are closest to buying, so 3–5 impressions per user per day is a solid starting range. Product detail page viewers who didn’t add to cart usually need a lighter push at 2–3 impressions per day. Past purchasers often need the lightest touch at 1–2 impressions per day.
Think of it like this: the closer someone is to checkout, the more often you can show up without wearing out your welcome.
Use Order-Level and Line-Item Controls Carefully
Amazon DSP gives you two layers of control. The order-level cap sets the total limit across line items, which means it restricts total impressions per user across the full order. The line-item cap controls a single audience or tactic. Used together, these settings help stop overlap from serving the same shopper too many times.
A practical setup might look like this:
- Cart abandoners: 5 impressions per day at the line-item level
- Past purchasers: 2 per day
- Cross-sell audiences: 1–3 per day
- Order-level ceiling: 8–10 impressions per day
That last piece matters. Set the order-level cap a bit above your most aggressive line-item cap so stacked audiences don’t push total delivery too high.
Frequency Cap Comparison Table
| Audience Type | Campaign Goal | Suggested Daily Cap | Key Tradeoff |
|---|---|---|---|
| Cart abandoners | Conversion recovery | 3–5 impressions/day | Higher conversion potential; taper down as the abandonment event ages |
| PDP viewers (no cart) | Consideration | 2–3 impressions/day | Balanced efficiency; avoid overspending on low-intent browsers |
| Past purchasers | Reorder / replenishment | 1–2 impressions/day | High cost efficiency; timing around the reorder window matters most |
| Cross-sell audiences | Basket expansion | 1–3 impressions/day | Moderate reach; introduce new products without overwhelming loyal customers |
| Win-back customers | Reactivation | 2–3 impressions/day | Test higher caps in the first half of a 30–60 day window; watch CPO closely |
Use these ranges as a starting point, then check performance with CTR, CVR, ROAS, and repeat-order rate. Start by watching CTR and CPO. If CTR falls while CPO climbs, that’s usually a sign the cap is too high. Once your caps settle in, connect each segment to a repeat-sales goal and track the lift.
Connect Retargeting to Repeat Purchase Goals and Measurement
Map Campaigns to Reorder and Loyalty Goals
Once your audiences are split and your frequency caps are in place, give each segment one clear repeat-purchase goal. That keeps targeting tighter and makes results much easier to read.
Replenishment campaigns should usually start around day 20 if the product has a 30-day supply. The logic is simple: show up before the customer runs out, not long after.
Cross-sell campaigns tend to work best between days 7 and 30 after the first purchase. At that point, the brand is still familiar, and the buyer is more likely to notice related products.
Win-back campaigns should focus on customers who have gone 1.5x to 2x past their usual reorder window without buying again. That’s often the point where a reminder can help, instead of just adding noise.
Measure Repeat-Sales Impact Beyond Basic ROAS
Top-line ROAS can look strong and still hide weak incrementality. Across 80 DSP retargeting audits, the average platform-attributed ROAS was 6.2x, while the actual incremental ROAS was only 1.4x.
That gap matters. If you only look at attributed conversions, you can end up giving the campaign credit for orders that likely would have happened anyway.
So measure incremental repeat behavior, not just reported conversions. The metrics that matter most are:
| Metric | What It Tells You |
|---|---|
| Repurchase rate | The share of customers who reorder within 30, 60, or 90 days of DSP exposure |
| Time between orders | Whether retargeting is shortening the gap between purchases |
| Cost per incremental order (CPIO) | The actual cost of orders driven by the campaign, not just nearby conversions |
| 6–12 month customer value | Average spend per customer over 6–12 months for exposed vs. unexposed cohorts |
Amazon DSP reporting gives you audience-level line-item reporting. Amazon Marketing Cloud (AMC) goes further, with custom queries across DSP and Sponsored Ads data. That means you can measure repeat purchase rates, multi-touch paths, and incrementality by comparing exposed and control groups.
Key Steps to Get Started
Start with campaigns in intent order: highest-intent shoppers first, then replenishment, cross-sell, and win-back. That sequence makes sense because it puts budget behind the audiences most likely to act now.
After those campaigns settle, add past-purchaser replenishment audiences based on the reorder timing you see in the Brand Analytics Repeat Purchase Behavior report. Then bring in cross-sell and win-back once the base setup is working well, since those audiences usually need more testing on the message side and tighter cost control.
At every stage, keep your eye on repeat-purchase outcomes: repurchase rate, CPIO, and 6–12 month customer value. ROAS still has a place, but it shouldn’t be the only number steering the account.
FAQs
How does Amazon DSP retargeting work?
Amazon DSP retargeting uses first-party data to bring back shoppers who already showed buying intent, whether that happened on Amazon or elsewhere.
That intent can come from actions like:
- Visiting a product detail page (PDP)
- Adding an item to cart
- Searching for related keywords
From there, Amazon DSP can show tailored video or display ads across Amazon-owned placements and third-party sites.
This is where retargeting starts to do its job. Instead of talking to a cold audience, you’re reaching people who already took a step.
Frequency caps help keep ad fatigue in check, so people don’t see the same ad over and over. You can also exclude people who already bought, which helps keep spend efficient and pushes budget toward shoppers who are still close to converting.
How do I know the right reorder window for my product?
Look at actual customer buying patterns and inventory cycles. Use Amazon Marketing Cloud (AMC) to measure your customer base’s average time between purchases.
That gives you a clearer sense of when people are likely to run out and become ready for a replenishment message. Then, in Amazon DSP, exclude recent purchasers so your budget stays focused on shoppers who are past their usual consumption window.
What metrics matter most beyond ROAS?
Beyond ROAS, pay attention to the numbers that show what happens before and after the click.
That means looking at engagement, sales, and long-term growth through metrics like click-through rate, conversion rate, brand recall, customer lifetime value, repeat purchase rate, and churn prediction.
It also helps to track inventory turnover and unit growth. Put together, these metrics give you a clearer picture of campaign performance and staying power than ad metrics alone.