

If you sell on both Amazon and Walmart, I would not judge them with the same benchmark tool. Amazon gives me more direct product and ad data, while Walmart leans more on listing quality, Item IDs, and proxy signals. That changes how I track pricing, inventory, ads, and margin.
Here’s the short version:
- Amazon tools focus on ASINs, Buy Box, BSR, ad metrics, and net margin after fees and ad spend
- Walmart tools focus on Item IDs, Listing Quality, Rich Media, pricing compliance, and channel-level stock checks
- Amazon Sponsored Products average about 4.4x ROAS
- Walmart Connect averages about 3.1x ROAS
- Amazon sellers in the $18–$35 range can see total take rates around 42%–47% after fees and ad spend
- Walmart referral fees are about 2.3 percentage points lower on average across key categories, and WFS has no inbound placement surcharge
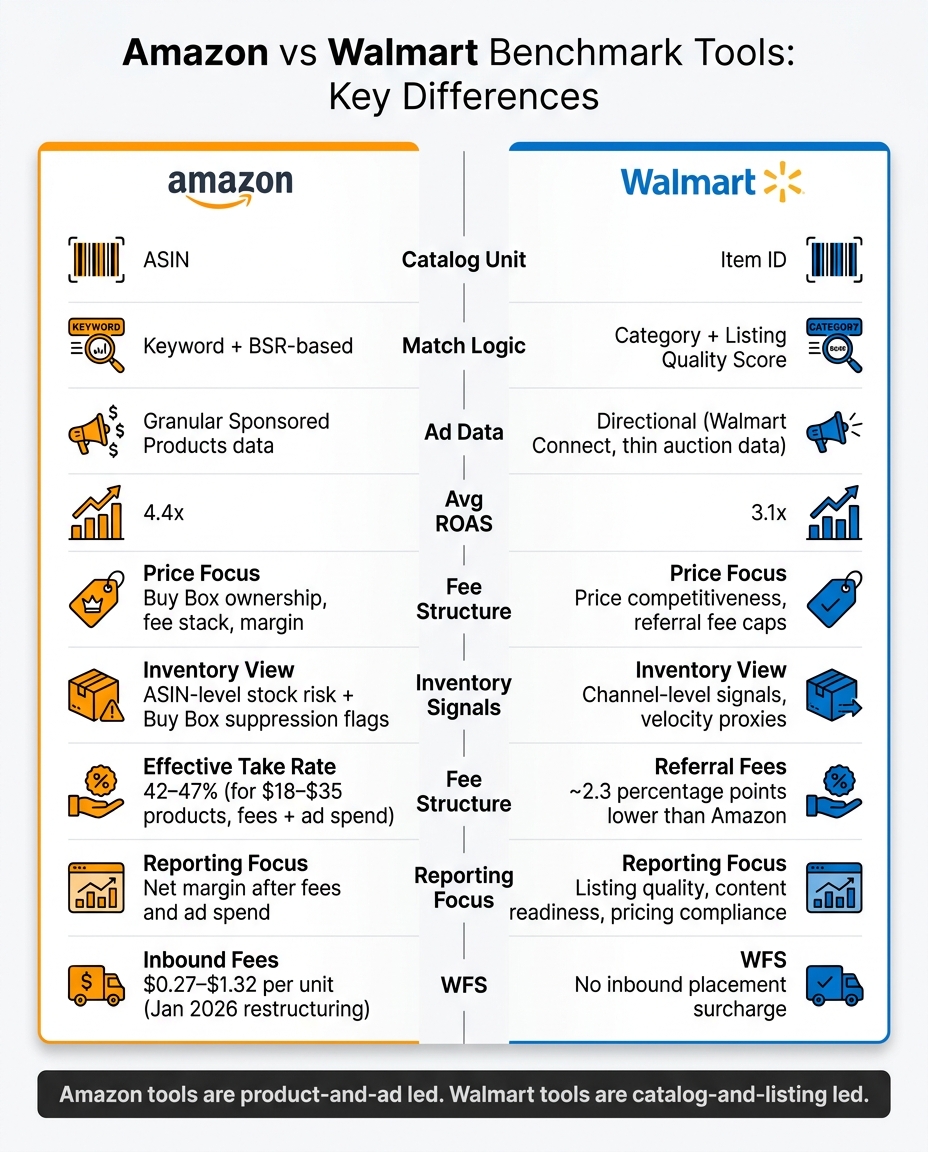
Amazon vs Walmart Benchmark Tools: Side-by-Side Comparison
Quick Comparison
| Area | Amazon | Walmart |
|---|---|---|
| Catalog unit | ASIN | Item ID |
| Match logic | Keyword and BSR | Category and listing quality |
| Ad data | More granular | More directional |
| Pricing focus | Buy Box, fee stack, margin | Price competitiveness, fee caps |
| Inventory view | ASIN-level stock risk | Channel-level signals |
| Reporting focus | Margin after fees + ads | Listing quality + content readiness |
If I had to sum it up in one line: Amazon benchmark tools are more product-and-ad led, while Walmart benchmark tools are more catalog-and-listing led.
sbb-itb-e2944f4
How Amazon benchmark tools work and what they prioritize
Amazon benchmark tools revolve around the ASIN. That means they track pricing, ad results, inventory, keyword rank, and margin at the product level.
Catalog structure and product match logic on Amazon
On Amazon, competitive sets often begin with keyword overlap and category context. In plain English, teams look for products going after the same shopper demand. That ASIN-level setup makes a big difference because it lets Amazon tools connect retail data and ad data to the same product.
Ad data, price tracking, and inventory signals on Amazon
Amazon tools connect impressions, clicks, CTR, CPC, and ROAS with BSR and organic rank. That gives teams a clearer way to compare media performance with retail results. Average ROAS on Amazon Sponsored Products is approximately 4.4x, which gives teams a solid reference point.
Price tracking should include Buy Box ownership and price changes because both can affect how competitive a listing is. Inventory monitoring matters just as much. Teams usually watch FBA stock status and inbound transit time closely, and many keep a backup FBM offer live during FBA inbound transit delays or stockouts.
Amazon’s January 2026 fee restructuring added inbound placement fees of $0.27 to $1.32 per unit, and sellers in the $18 to $35 price range can see effective margin of 42% to 47% when all fees and sponsored spend are included. Because of that, Amazon reporting is moving toward net unit margin after fees and ad spend. So instead of looking at revenue alone, teams benchmark margin after fees and ad spend. That same product-level view also shapes how they track pricing, inventory, and margin.
Reporting workflows Amazon teams typically need
Most Amazon teams report at the ASIN level. They usually combine ad, price, Buy Box, keyword, inventory, and margin data in dashboards or BI tools.
How Walmart benchmark tools differ in data and decision-making
Walmart benchmark tools look at the catalog through a different lens than Amazon tools. They lean on Item IDs and listing quality signals, which means they put more weight on catalog health and operational readiness. That shifts both product matching and the way performance gets judged.
Catalog structure and product matching on Walmart
Walmart runs on an Item ID-based catalog, so benchmark tools center their matching around Item IDs and the quality of the content tied to each record. Listing Quality Scores matter a lot. Tools also need to show whether a listing includes Rich Media, because Walmart’s ranking algorithm penalizes listings that don’t have it.
That changes the whole matching process. Instead of leaning on Amazon-style keyword mirroring, Walmart tools are more catalog-led.
Reviews also play a smaller role here. Since Walmart reviews tend to build at a slower pace, benchmark tools put less weight on review volume and more on listing quality, content completeness, and whether the product page is ready to perform.
Walmart Connect, pricing insights, and inventory benchmarks
Walmart Connect data can help, but there’s a catch. The auction depth is more limited, so CPC and traffic patterns are less predictable. Because of that, tools usually treat ad benchmarks as directional, not fixed.
Brand protection works differently too. Enforcement is less automated than Amazon’s Brand Registry, so teams often rely on third-party monitoring to spot pricing compliance issues and brand protection problems.
Inventory is another big part of the picture. Walmart does not use a commingled inventory model, so tools need separate stock checks by channel and fulfillment method. In practice, that means Walmart teams often lean more on operational reporting than ad-heavy dashboards.
Reporting workflows Walmart teams typically need
Most Walmart teams report on a small set of core areas:
- Item Health
- Listing Quality
- Pricing compliance
- Stock status
- Content readiness
The gap between Walmart and Amazon gets easier to see when you compare them side by side across catalog matching, ad data, pricing, and inventory signals.
Amazon vs Walmart benchmark tools: key differences side by side
Amazon and Walmart benchmark in different ways, so one tool can’t judge both marketplaces with the same logic. The summary below shows where that split shows up in tool design and day-to-day reporting.
Catalog, matching, and ad data integration: how they compare
Amazon tools work with richer native platform signals. Walmart tools lean more on proxy signals.
On Amazon, tools usually center on ASINs and use BSR-based matching. On Walmart, tools center on Item IDs and use match logic tied more closely to listing quality scoring. That shift matters because it changes which competitors each tool pulls into view.
The ad data gap follows the same pattern. Average ROAS on Amazon Sponsored Products is 4.4x, compared to 3.1x on Walmart Connect. So Amazon tools can usually show ad benchmarks with more certainty. Walmart tools, on the other hand, tend to treat ad benchmark data as more directional.
You can see the split most clearly in matching, ads, pricing, and inventory.
| Feature | Amazon Benchmark Tools | Walmart Benchmark Tools |
|---|---|---|
| Catalog model | ASIN-led | Item ID-led |
| Variation handling | Parent/Child ASIN relationships | Item ID grouping with Rich Media requirements |
| Match logic | Keyword and BSR-based | Category and listing quality-based |
| Ad metrics granularity | Granular Sponsored Products data | Walmart Connect, auto-bidding, thin auction data |
Price tracking, inventory signals, and reporting: how they compare
Pricing is another big point of separation. Amazon tools have to deal with a more layered fee stack. Amazon’s effective take rate for products in the $18–$35 range can hit 42–47% once fees and ad spend are included. Walmart is simpler here: its referral fees average 2.3 percentage points lower than Amazon’s across key categories, and WFS has no inbound placement surcharge.
That makes Walmart price tracking easier to model. But it also means the market signals these tools watch are not the same.
On inventory, Amazon tools tend to report stock risk at the ASIN level and can flag Buy Box suppression during inbound delays. Walmart tools usually report inventory in a more indirect way and by channel, often using velocity proxies instead of direct stock signals.
That difference shapes reporting too. Amazon reporting leans harder into margin pressure after fees and ad spend. Walmart reporting puts more weight on listing quality, content readiness, and pricing compliance.
| Feature | Amazon Reporting Needs | Walmart Reporting Needs |
|---|---|---|
| Price tracking | Price history, Buy Box movement, inbound fees | Price competitiveness, referral fee caps |
| Repricing signals | Buy Box floor, FBM fallback pricing | MAP compliance monitoring |
| Competitor stock visibility | ASIN-level stock risk, Buy Box suppression flags | Inventory velocity proxies, channel-level signals |
| Reporting focus | Net margin after fees and ad spend | Listing quality, content readiness, pricing compliance |
Conclusion: Choosing the right benchmark tool setup for your marketplace
Amazon and Walmart benchmark tools are not interchangeable. Each marketplace gives you different signals, different blind spots, and different costs. That should guide how you pick your setup.
Use Amazon tools for Sponsored Products and fee-aware margin analysis. Use Walmart tools for listing quality, Rich Media, and channel-level inventory.
The right benchmark setup follows the signals each marketplace gives you natively, then uses proxy data only where there’s a gap. That matters even more as more brands grow on Walmart. In that case, benchmark data only pays off when it leads to marketplace-specific action.
For brands that need to act on those differences, Emplicit helps brands turn benchmark insights into marketplace-specific actions across Amazon and Walmart.
FAQs
Why can’t one benchmark tool judge Amazon and Walmart equally?
A single benchmark tool can’t judge Amazon and Walmart on the same scale because each marketplace runs on its own data structure, reporting format, and shopping behavior.
Take metrics like revenue, conversion rate, and ad costs. They aren’t standardized across both platforms, so you have to normalize them before making a fair comparison. Otherwise, you’re comparing apples to oranges.
The differences go past reporting, too. Amazon and Walmart each have their own level of competition, ad auction patterns, fee setup, logistics systems, inventory models, and shopper search intent. That’s a big deal.
When a tool uses the same benchmark for both marketplaces, it can gloss over those platform-specific details and lead to insights that are less accurate.
Which metrics matter most on Amazon versus Walmart?
On Amazon, the key metrics to watch are BSR, Buy Box win rate, ACoS, ROAS, and TACoS. These tell you a lot about demand, product visibility, and how well your ad spend is paying off.
On Walmart, conversion rate and order defect rate matter most. That’s because Walmart puts more weight on seller reliability and shipping performance.
Across both marketplaces, it helps to track GMV, contribution margin, and SOV or SoS. Those give you a steady way to benchmark performance side by side.
How should I benchmark products if I sell on both marketplaces?
Use one dashboard for Amazon and Walmart data so you can see sales, inventory, and ad performance in the same place. That setup makes it easier to normalize metrics like conversion rate and revenue, so you’re comparing like-for-like numbers instead of mixed reporting.
Focus on shared KPIs such as Gross Merchandise Value, Customer Acquisition Cost, and TACoS. Match products with SKUs or barcodes so each item lines up correctly across both channels.
It also helps to watch pricing, organic rankings, and market share side by side. Those numbers can steer day-to-day calls on price changes, inventory planning, and where to put ad dollars.