Managing sales on Amazon and Walmart can be frustrating due to their separate systems, different fee structures, and mismatched data formats. Sellers often spend 5–10 hours weekly manually consolidating data, leading to costly errors like stockouts, which can result in losses exceeding $50,000 annually. Without a unified reporting system, it’s nearly impossible to determine true profitability per product or identify which platform performs better.
Key Takeaways:
- Amazon and Walmart operate with different reporting formats, fee structures, and payout schedules.
- Manual data consolidation wastes time and increases the risk of errors.
- Unified reporting connects both platforms, providing one source of truth for revenue, inventory, and profitability.
Solution Highlights:
- Integrate APIs: Automate data transfers from Amazon and Walmart into a single system.
- Standardize Metrics: Focus on key measures like contribution margin and TACoS.
- Use Dashboards: Tools like Power BI or Tableau can visualize performance for better decisions.
- Normalize Fees: Reconcile differences in referral fees, storage costs, and payout schedules.
- Link Products: Use a master catalog to track SKUs across both platforms.
Unified reporting saves 5–10 hours per week, reduces errors, and ensures smarter decisions by focusing on profitability instead of vanity metrics.
The Problem: Managing Separate Reporting Systems
Different Data Formats
Amazon Seller Central and Walmart Seller Center speak entirely different "languages" when it comes to data. Each platform has its own reporting formats and APIs, making even a straightforward question like, "What’s my total revenue this month?" a logistical headache. To get an answer, you’d need to download two separate spreadsheets, manually merge them, and then wrestle with the differences.
But it’s not just about file formats. The platforms have fundamentally different structures. For example:
- Amazon settles payments bi-weekly and holds reserves, while Walmart processes payouts weekly.
- Amazon’s referral fee is typically around 15% for most categories, but Walmart’s is closer to 8%.
- Amazon uses 7- or 14-day attribution windows, while Walmart sticks to 14 days.
These differences make it nearly impossible to align data for side-by-side comparisons.
And that’s just the start. SKU naming inconsistencies – like "Red Shirt" on one platform and "Shirt-Red" on another – can throw off automated inventory mapping. This leads to failed updates, duplicate orders, and hours spent cleaning up errors.
"Managing Amazon and Walmart simultaneously creates an accounting nightmare that grows with every order." – Yvette Zhou, Group Product Manager, Webgility
Manual Data Consolidation Costs
The time spent managing these separate systems adds up fast. Sellers juggling multiple marketplaces often dedicate hours every week to manual reporting tasks. For mid-sized businesses, this can mean over 20 hours a month just reconciling payouts, fees, and refunds.
Take PartyMachines, for instance. Before automating their reporting, they spent two to three weeks every month manually entering data into QuickBooks to reconcile sales from Amazon and Walmart. After switching to an automated integration system, they slashed reconciliation time to just a few hours, freeing up about 16 hours of staff time each week. With over 1,000 orders processed monthly, they finally gained SKU-level profitability insights that were previously buried under manual errors.
For agencies managing multiple clients, the costs skyrocket. Labor expenses for manual reporting can reach $180,000 to $216,000 annually for every 20 clients. And by the time these reports are completed, they’re often 5 to 7 days out of date. This lag in data not only wastes time but also clouds the accuracy of performance metrics, leading to costly missteps.
Poor Decision-Making from Incomplete Data
When your data is fragmented across platforms, you’re essentially making decisions in the dark. The gaps and inconsistencies in manual processes make it tough to get a clear picture of what’s actually happening. For example, you might think Walmart is driving growth when, in reality, it’s just pulling customers away from Amazon – a phenomenon known as channel cannibalization. Without unified reporting, this critical insight remains hidden.
"A single missed fee calculation can hide margin erosion for months." – Yvette Zhou, Group Product Manager, Webgility
Pricing decisions are especially vulnerable. Without consolidated data showing true costs across platforms, many sellers rely on incomplete or outdated information. Errors creep in – broken pivot tables, outdated formulas, or even simple version control issues.
The financial stakes are high. Poor inventory visibility, for example, can lead to stockouts that cost mid-sized sellers over $50,000 annually. These blind spots also make it impossible to identify which products and platforms actually drive profit after factoring in variable costs. Without this clarity, sellers risk misallocating resources and missing opportunities to grow their business effectively.
sbb-itb-e2944f4
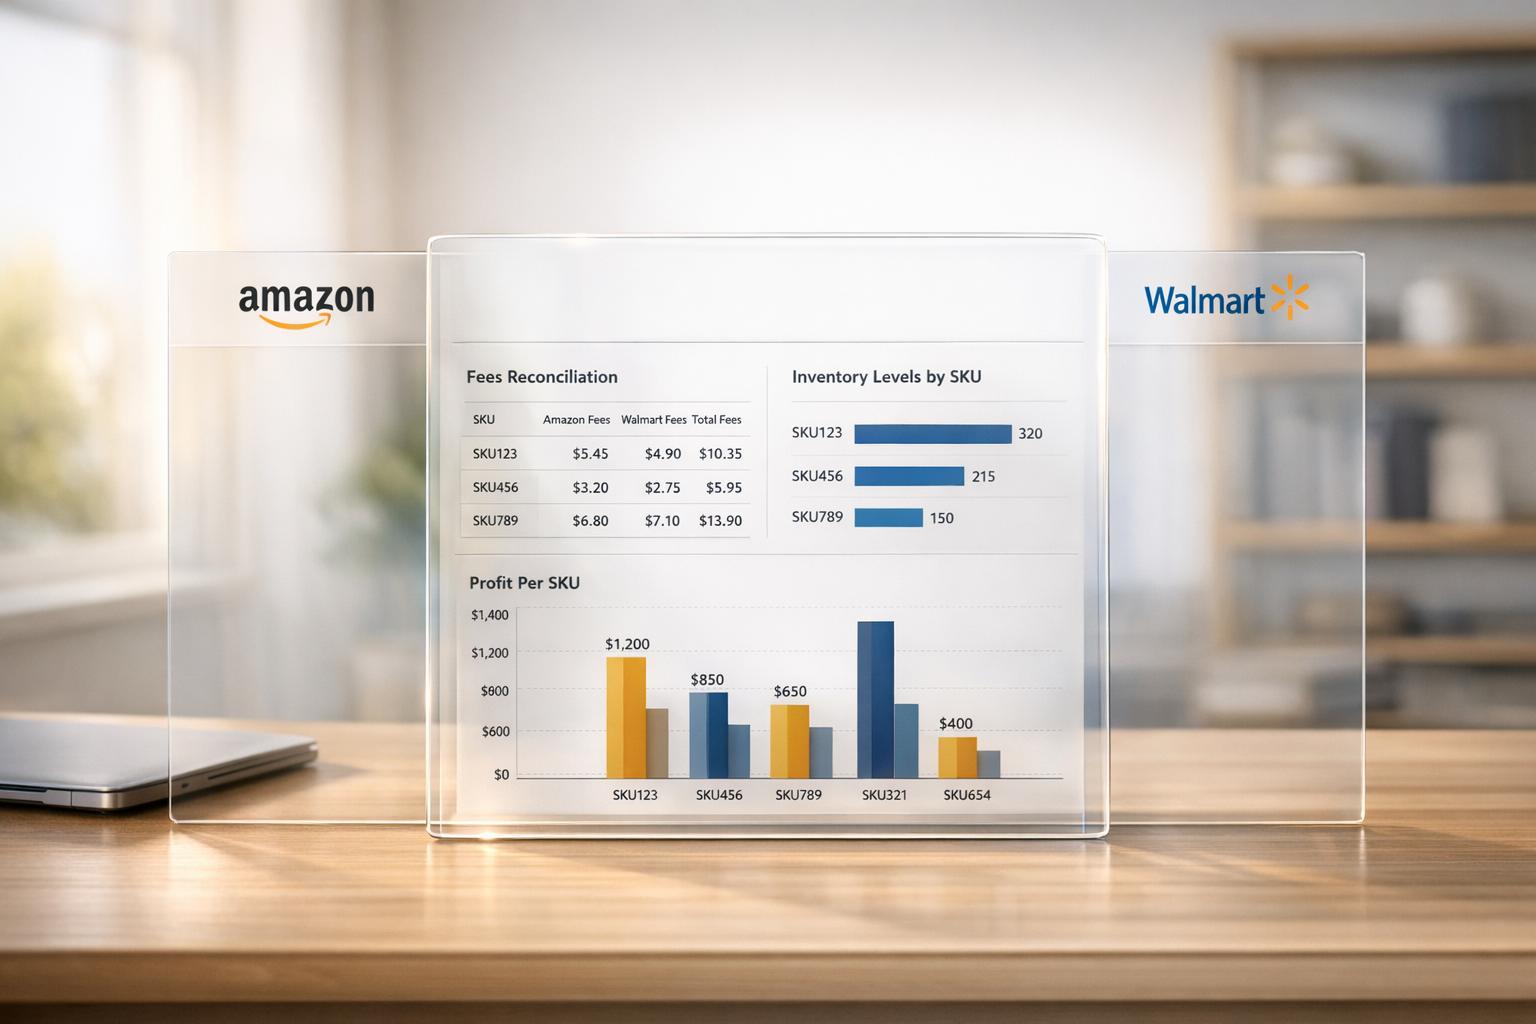
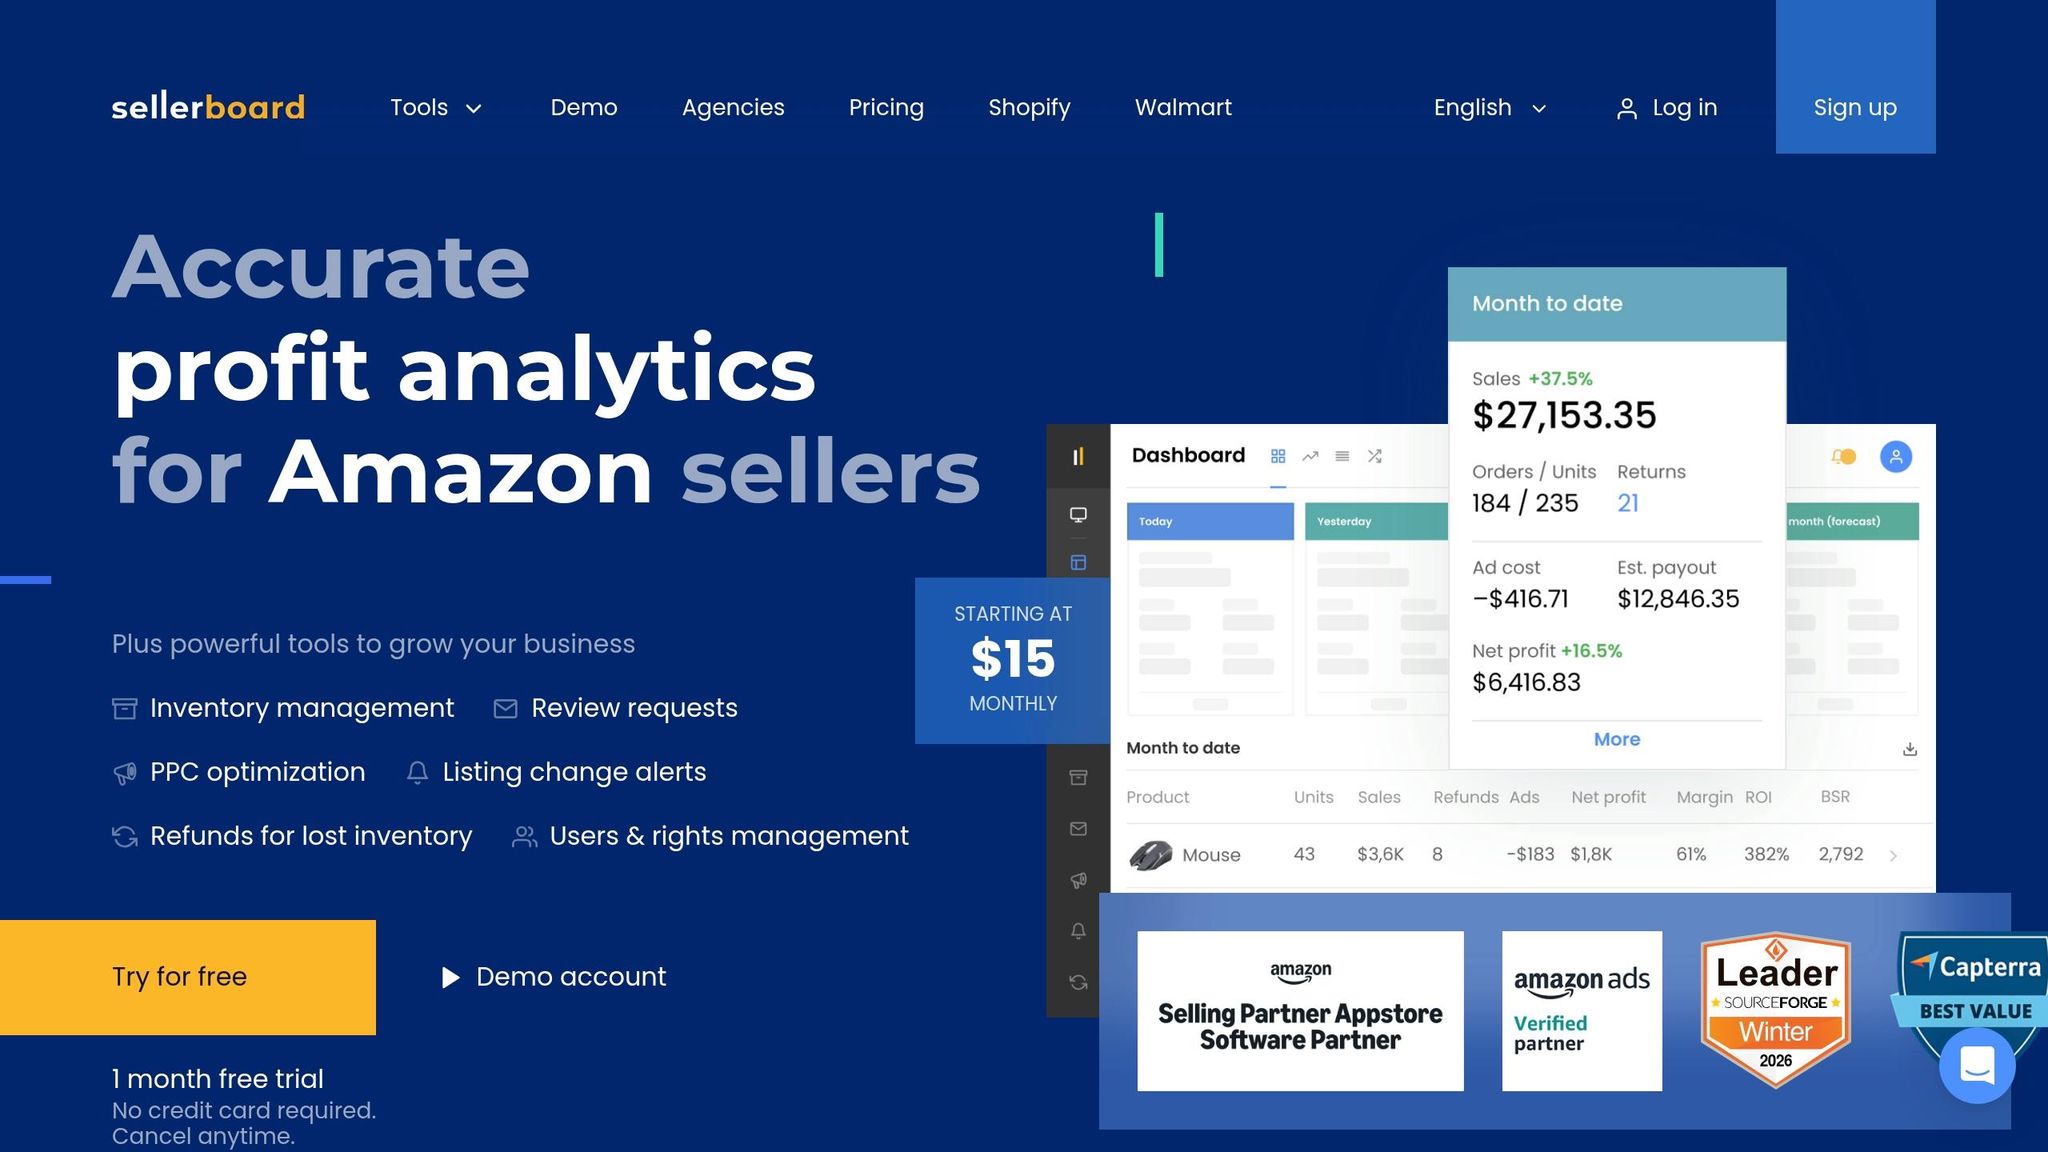
Easily Track Amazon and Walmart Profits in One Dashboard With sellerboard
How to Build a Unified Reporting System
Given the challenges of fragmented data discussed earlier, creating a unified reporting system is essential for efficiency and accuracy.
Connecting Data from Both Platforms
The first step in unified reporting is integrating APIs. Amazon’s Selling Partner API (SP-API) and Walmart’s Marketplace APIs enable real-time data transfers for orders, inventory, and finances directly into your system. This eliminates the need for manually downloading and processing CSV files.
One challenge is that Amazon and Walmart structure their data differently – Amazon uses "OrderItem", while Walmart uses "OrderLine." To reconcile this, you need to standardize the data formats for consistency. Integration platforms or ETL tools can automate this process, saving time and effort.
"iPaaS acts as the central hub. Orders from Amazon (Webhooks) and Walmart (API) flow into iPaaS, then to ERP/WMS."
– Clarity Ventures
Setting up these integrations typically takes 2 to 4 weeks, but the benefits are immediate. Real-time inventory synchronization can improve accuracy to 99% and cut fulfillment cycles by over 50%. To ensure smooth operations, use consistent SKU naming across platforms – for example, "SHIRT-RED-M" – to avoid mapping errors and maintain data accuracy.
Once your data is integrated and normalized, the next step is to establish consistent performance metrics for actionable insights.
Creating Standard Metrics and KPIs
After connecting your data, it’s crucial to define metrics that work across platforms. Start by standardizing on a 14-day attribution window and focus on key metrics like TACoS (Total Advertising Cost of Sale). This is calculated by dividing total ad spend by total revenue, providing a clear picture of advertising performance. A healthy TACoS target typically falls between 8% and 15%.
Another critical metric for multi-marketplace sellers is the contribution margin by product and channel. This metric reveals true profitability after accounting for variable costs like referral fees, fulfillment fees, advertising, shipping, and returns. Aim for contribution margins of 15% to 30%.
"Contribution margin by product by channel is the single most important multi-marketplace metric."
– ECOSIRE Research and Development Team
Organize your KPIs into levels for better tracking:
- Level 1 (Executive): Tracks overall revenue, orders, and gross margin across all platforms.
- Level 2 (Channel): Breaks down revenue and contribution margin by marketplace.
- Level 3 (Product): Focuses on SKU-level performance, return rates, and advertising efficiency.
Using Centralized Dashboards
Once your data is integrated and metrics are standardized, use visualization tools to make sense of it all. Platforms like Looker Studio, Power BI, or Tableau let you create interactive dashboards that consolidate data from multiple sources in one place.
Set up automated alerts for critical events, such as inventory dropping below reorder points, account health metrics nearing thresholds (e.g., an Order Defect Rate close to 1%), or price discrepancies between platforms. These alerts turn your dashboard into a proactive management tool.
For high-volume sellers, analytics platforms tailored to marketplace data can be implemented in just a few days. These tools often pay for themselves within 2 to 3 months by saving time and improving decision-making. Multi-marketplace sellers typically save 5 to 10 hours per week by eliminating manual reporting tasks.
Managing Campaigns Across Both Platforms
Once you’ve set up your reporting system, the next step is running ad campaigns that perform well on both Amazon and Walmart. The goal here is to avoid duplicating work while still taking advantage of what each platform does best. A smooth flow of data not only shapes your strategy but also simplifies campaign execution. With well-structured campaigns in place, it’s time to fine-tune them for each platform’s unique features.
Setting Up Consistent Campaign Structures
Organize your campaigns around objectives like Brand Defense, Category Conquest, and Discovery to align with specific performance goals. Use a clear naming convention, such as [Platform]-[Brand]-[Category]-[Match Type]-[Goal], to make filtering and performance analysis easier.
For budgeting, try the 70/20/10 rule:
- 70% goes to campaigns with a proven track record.
- 20% is allocated to testing new audiences.
- 10% is reserved for experimental ideas.
When testing campaigns, run them for at least two weeks. Only move them into the "proven" category if they meet your Return on Ad Spend (ROAS) benchmarks.
Take advantage of keyword cross-pollination by exporting Amazon’s best-performing search terms (those with at least three conversions and a favorable ACOS) and using them as exact match keywords for Walmart campaigns. This approach lets you leverage Amazon’s robust search data to boost Walmart’s ad performance.
Once your campaign structures are standardized, the next focus should be on tailoring your tactics to each platform.
Adapting to Platform-Specific Features
While your overall goals should remain consistent, your approach needs to adjust to the differences between Amazon and Walmart. For instance, Walmart’s average Cost-Per-Click (CPC) is 40–50% lower than Amazon’s. Start Walmart bids at 30–40% below Amazon’s for similar keywords. Keep in mind that the two platforms operate in very different ad environments – Amazon controls about 75% of U.S. marketplace ad spend, while Walmart Connect’s ad revenue has been growing rapidly, with projections reaching $6.2 billion by 2026.
Another key difference is attribution windows. Amazon typically uses a 7-day window for Sponsored Products, while Walmart applies a 14-day window across all ad types. To make fair comparisons, either use Amazon’s 14-day reporting option or adjust Walmart’s reported sales down by 10–15%.
"The brands that win at omnichannel are not the ones with the biggest budgets. They are the ones who can see the full picture fastest and act on it."
– Nectar Blog
Walmart Connect has limited negative keyword functionality, so you’ll need to focus on precise keyword selection and manual bid adjustments to minimize irrelevant traffic. Use broad match keywords on Walmart to uncover search behavior specific to its shoppers – especially in categories like groceries and general merchandise, where terminology often differs from Amazon.
Lastly, connect your ad platforms to live inventory data. This allows you to automatically pause campaigns or lower bids when stock levels dip below reorder thresholds. Doing so prevents wasted ad spend on items that are out of stock and helps maintain strong account metrics. These platform-specific tweaks, guided by unified analytics, ensure smarter spending and better ROI.
Combining Financial Data from Both Platforms
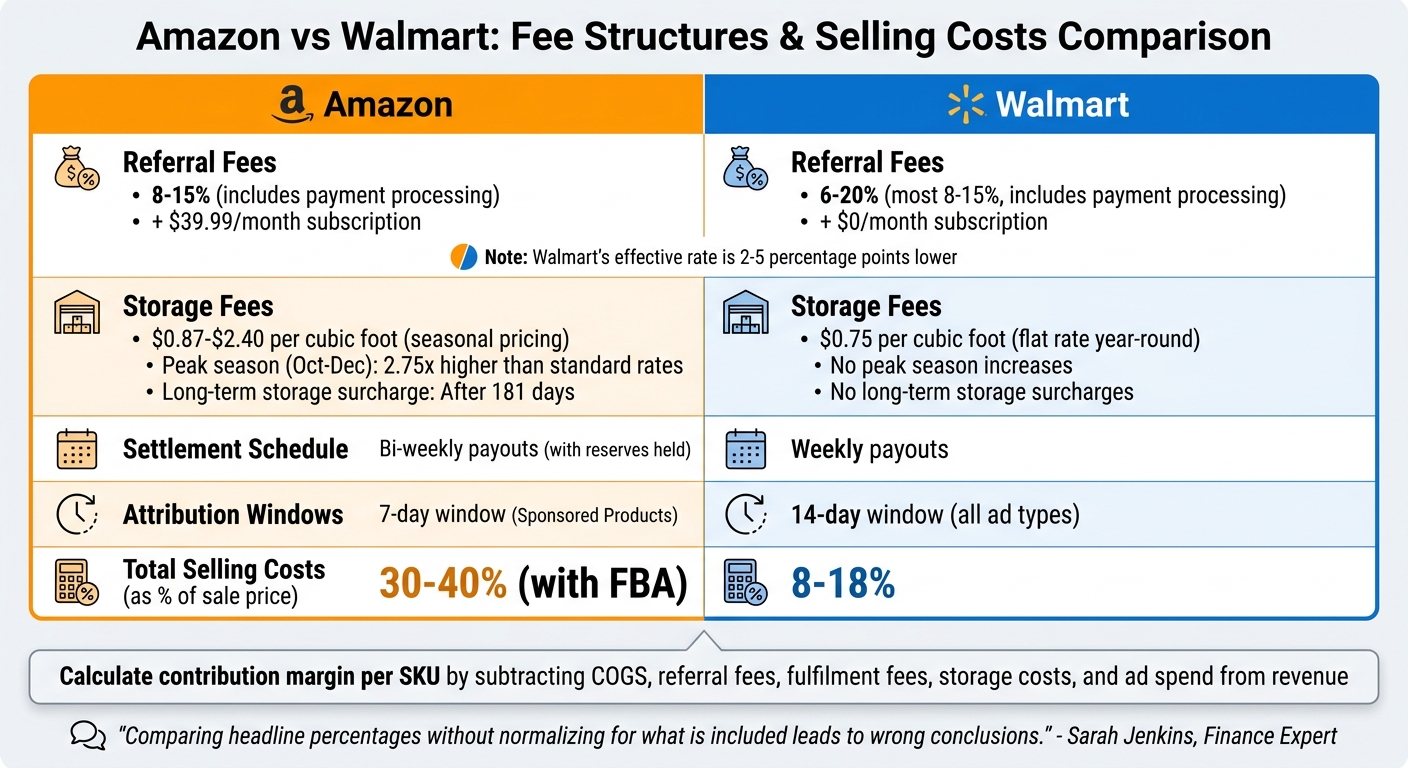
Amazon vs Walmart Fee Structures and Selling Costs Comparison
Ads and sales metrics alone don’t tell the whole story when it comes to profitability. The real challenge is figuring out true profitability when selling on both Amazon and Walmart. Each platform has its own unique fee structures, settlement schedules, and cost breakdowns. Without combining this data, it’s nearly impossible to get a clear picture of how profitable your products actually are. Consolidating these metrics ties financial data directly to reporting insights, giving you a complete view of your business performance across both marketplaces.
Normalizing Fee Structures
Amazon and Walmart have different ways of charging fees, which makes comparing them side-by-side tricky. For example, Amazon includes payment processing in its referral fees, which typically range from 8–15% depending on the category. They also charge a $39.99 monthly professional subscription fee. On the other hand, Walmart also bundles payment processing into referral fees, which range from 6–20% (with most falling between 8–15%), but Walmart doesn’t charge a monthly fee. This difference can lower Walmart’s effective rate by 2–5 percentage points for some sellers.
Then there are storage fees, which add another layer of complexity. Amazon uses seasonal pricing for storage, charging between $0.87 and $2.40 per cubic foot, with peak-season rates (October–December) being almost 2.75 times higher than standard rates. Walmart keeps things simpler with a flat $0.75 per cubic foot rate year-round, with no peak-season increases. Additionally, Amazon imposes steep surcharges on inventory that sits for more than 181 days, while Walmart doesn’t.
"Comparing headline percentages without normalizing for what is included leads to wrong conclusions." – Sarah Jenkins, Finance Expert, Nventory US
To get an accurate profitability picture, calculate the contribution margin per SKU for each platform. This involves subtracting costs like COGS, referral fees, fulfillment fees, storage costs, and ad spend from your revenue. On average, total selling costs for Amazon with FBA run 30–40% of the sale price, compared to 8–18% on Walmart. Keep in mind that marketplaces often adjust their fees, so reviewing fee schedules quarterly is essential to avoid hidden margin losses.
Once fees are normalized, the next step is ensuring your product data is properly connected across both platforms.
Linking Products Across Platforms
To measure performance across Amazon and Walmart, you need to connect the same product on both platforms. A master catalog approach is the best way to do this. By linking each product’s Amazon ASIN and Walmart Item ID to a single internal SKU, you can consolidate revenue, fees, and ad spend for each product.
Using universal identifiers like UPC or EAN codes makes it easier to map products across platforms automatically. Set up a one-way data flow where all changes are made in your master catalog and then pushed to the marketplaces. Avoid making direct edits on individual platforms to prevent synchronization issues. For platform-specific needs, like varying keyword strategies, use an override layer in your management system instead of editing listings directly. Perform a data quality audit every 30 days to catch issues like SKU mismatches, missing UPCs, or orphaned listings that aren’t properly linked.
Measuring Combined ROI
Once fees are normalized and products are linked, you can measure ROI more accurately. Start by aligning attribution windows – Amazon typically uses a 7-day window for Sponsored Products, while Walmart uses a 14-day window across all ad types. To ensure consistency, use Amazon’s 14-day reporting option for a fair comparison.
Track metrics like TACoS (total ad cost of sales) to evaluate ad spend against total revenue across both marketplaces. Instead of just focusing on ROAS, dive deeper into contribution margin by product and channel to account for all variable costs. This helps you identify which products are truly profitable on each platform, not just the ones driving the most sales.
Finally, address timing differences in payouts – Amazon settles bi-weekly, while Walmart pays weekly. Automated tools can sync transactions into your accounting software in real time, making reconciliation easier. Without automation, manual reconciliation can take over 20 hours per month for mid-sized sellers. Using automation can cut that time by up to 90%.
Conclusion: Benefits of Unified Reporting
Unified reporting isn’t just about organizing data – it transforms how businesses manage operations across multiple marketplaces. By replacing manual data consolidation with a single, real-time dashboard, it eliminates inefficiencies and reduces the chance of costly mistakes like stockouts.
But the benefits go deeper. Unified reporting sharpens strategic decision-making by focusing on what truly matters. Instead of being distracted by vanity metrics, businesses can zero in on profitability. As the ECOSIRE Team wisely states:
"Revenue is vanity; contribution margin is sanity"
It also enhances risk management. Automated alerts for account health issues or pricing discrepancies allow businesses to act quickly, avoiding disruptions. Plus, keeping revenue from any single channel under 50% minimizes platform-specific risks, ensuring a more resilient operation.
For businesses handling over 500 orders per month, the time saved and smarter decisions made with a robust reporting dashboard often cover the investment within 2–3 months. Agencies benefit too, with productivity gains of 30–35% and up to 20% lower client churn by cutting out tedious manual workflows.
In short, unified reporting lays the groundwork for scalable growth across marketplaces – without the chaos of endless spreadsheets.
FAQs
What data should I unify first – orders, inventory, ads, or fees?
Start by bringing together inventory data to prevent stockouts and overstocking – issues that cost U.S. retailers a staggering $1.75 trillion every year. Centralizing this information allows for accurate, real-time updates across all platforms, ensuring operations stay on track without unnecessary disruptions.
How do I match the same SKU across Amazon and Walmart reliably?
To effectively match SKUs on Amazon and Walmart, set up a centralized SKU management system. This system should map your internal SKUs to platform-specific identifiers, such as ASINs for Amazon and UPCs/GTINs for Walmart. Assign a distinct internal SKU to every product, and use automation tools to keep synchronization seamless and accurate. Regular validation of these mappings is crucial to avoid errors and ensure that inventory, listings, and stock levels remain consistent across both platforms.
How can I compare Amazon and Walmart ad results with different attribution windows?
When comparing ad performance between Amazon and Walmart, it’s important to account for their different attribution models. Amazon generally operates with a 14-day attribution window, while Walmart uses a 30-day window. To make fair comparisons, you can align these timeframes by using a unified reporting system or implementing custom analytics.
Also, keep an eye on platform-specific updates, such as Amazon’s shopping-signal changes, to ensure your performance analysis remains accurate and up-to-date. These adjustments can significantly impact how you interpret results.